Balancing DFDs
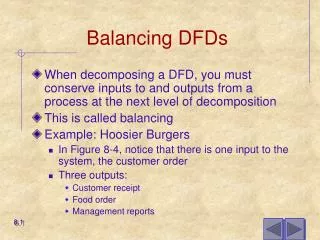
Balancing DFDs. When decomposing a DFD, you must conserve inputs to and outputs from a process at the next level of decomposition This is called balancing Example: Hoosier Burgers In Figure 8-4, notice that there is one input to the system, the customer order Three outputs: Customer receipt

Balancing DFDs
E N D
Presentation Transcript
Balancing DFDs • When decomposing a DFD, you must conserve inputs to and outputs from a process at the next level of decomposition • This is called balancing • Example: Hoosier Burgers • In Figure 8-4, notice that there is one input to the system, the customer order • Three outputs: • Customer receipt • Food order • Management reports 8.1
Balancing DFDs • Example (Continued) • Notice Figure 8-5. We have the same inputs and outputs • No new inputs or outputs have been introduced • We can say that the context diagram and level-0 DFD are balanced 8.2
Balancing DFDs • An unbalanced example • Figure 8-10 • In context diagram, we have one input to the system, A and one output, B • Level-0 diagram has one additional data flow, C • These DFDs are not balanced 8.3
Figure 8-10An unbalanced set of data flow diagrams(a) Context diagram(b) Level-0 diagram 8.4
Balancing DFDs • We can split a data flow into separate data flows on a lower level diagram (see Figure 8-11) • Balancing leads to four additional advanced rules (See Table 8-3) 8.5
Example of data flow splitting (a) Composite data flow (b) Disaggregated data flow 8.6
Four Different Types of DFDS • Current Physical • Process label includes an identification of the technology (people or systems) used to process the data • Data flows and data stores are labeled with the actual name of the physical media on which data flow or in which data are stored 8.8
Four Different Types of DFDS • Current Logical • Physical aspects of system are removed as much as possible • Current system is reduced to data and processes that transform them • New Logical • Includes additional functions • Obsolete functions are removed • Inefficient data flows are reorganized 8.9
Four Different Types of DFDS • New Physical • Represents the physical implementation of the new system 8.10
List of activities involved in Bob Mellankamp’s inventory control system for Hoosier Burger 8.11
Hoosier Burger’s current physical inventory control system Context diagram 8.12
Hoosier Burger’s current physical inventory control system Level-0 data flow diagram 8.13
Level-0 data flow diagram for Hoosier Burger’s current logical inventory control system 8.15
Level-0 data flow diagram for Hoosier Burger’s newlogical inventory control system 8.16
Guidelines for Drawing DFDs • Completeness • DFD must include all components necessary for system • Each component must be fully described in the project dictionary or CASE repository • Consistency • The extent to which information contained on one level of a set of nested DFDs is also included on other levels 8.17
Hoosier Burger’s hiring procedures Data flow diagram 8.18
Guidelines for Drawing DFDs • Timing • Time is not represented well on DFDs • Best to draw DFDs as if the system has never started and will never stop. • Iterative Development • Analyst should expect to redraw diagram several times before reaching the closest approximation to the system being modeled 8.20
Guidelines for Drawing DFDs • Primitive DFDs • Lowest logical level of decomposition • Decision has to be made when to stop decomposition 8.21
Guidelines for Drawing DFDs • Rules for stopping decomposition • When each process has been reduced to a single decision, calculation or database operation • When each data store represents data about a single entity • When the system user does not care to see any more detail 8.22
Guidelines for Drawing DFDs • Rules for stopping decomposition (continued) • When every data flow does not need to be split further to show that data are handled in various ways • When you believe that you have shown each business form or transaction, on-line display and report as a single data flow • When you believe that there is a separate process for each choice on all lowest-level menu options 8.23
Using DFDs as Analysis Tools • Gap Analysis • The process of discovering discrepancies between two or more sets of data flow diagrams or discrepancies within a single DFD • Inefficiencies in a system can often be identified through DFDs 8.24
Using DFDs in Business Process Reengineering • Example: IBM Credit • See Figure 8-20 – before reengineering • Credit approval process required six days before BPR • Figure 8-21 depicts DFD after reengineering • IBM was able to process 100 times the number of transactions in the same amount of time 8.25
IBM Credit Corporation’s primary work process before BPR 8.26
IBM Credit Corporation’s primary work process after BPR 8.27
Oracle’s Process Modeler and Functional Hierarchy Diagrams • Process Modeler • Unique to Oracle • Similar to DFDS but outputs and methods differ in several ways. • Table 8-4 illustrates differences • Functional Hierarchy Diagrams • Picture of various tasks performed in a business and how they are related • Tasks are broken down into their various parts • Does not include data flows 8.28
Summary • Data flow diagrams (DFD) • Symbols • Rules for creating • Decomposition • Balancing • Four different kinds of DFDs • Current Physical • Current Logical • New Logical • New Physical 8.29
Summary • DFDs for Analysis • DFDs for Business Process Reengineering (BPR) • Oracle’s Process Modeler • Functional Hierarchy Diagrams 8.30