Excel: Pivot Tables
Excel: Pivot Tables. Computer Information Technology Section 6-18. The student will Understand what p ivot tables are used for. Know how to create a basic pivot table Know how to add a calculation into a pivot table. Objectives. Pivot Tables in Excel are one of the most powerful tools


Excel: Pivot Tables
E N D
Presentation Transcript
Excel: Pivot Tables Computer Information Technology Section 6-18
The student will • Understand what pivot tables are used for. • Know how to create a basic pivot table • Know how to add a calculation into a pivot table. Objectives
Pivot Tables in Excel are one of the most powerful tools • A pivot table is a great tool for sorting and summarizing the data in a worksheet or database file. • Pivot tables can automatically sort, count, and total spreadsheet data and then create a second table to display the summarized data. • Forget Filters and Subtotal, Pivot Tables can do both of these and more in a few seconds. Excel: Pivot Tables
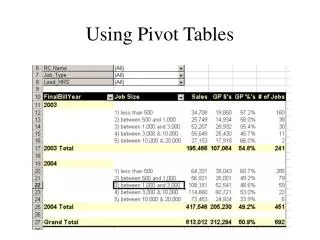
What if we wanted to SUM the number of viewers by program, going down the rows, then by Region going across the columns and only show Q1? Excel: Pivot Tables
I could sort, and use subtotals and get: Excel: Pivot Tables • But what I want is this:
1) Click anywhere in your data • 2) On the ‘Insert’ tab click the ‘PivotTable’ button and select ‘PivotTable’. Excel: Creating a Pivot Table
3) The Create PivotTable dialog box will open. Excel: Creating a Pivot Table • Check the range of data • Decide if you want the pivot table in a New Worksheet or the existing worksheet
New sheet will look like this: Excel: Creating a Pivot Table
Click and drag the fields you want into the areas at the bottom Excel: Creating a Pivot Table
With a few clicks I can clean up the table: Excel: Creating a Pivot Table
With a field you can also add a predefined calculation… • In this case I want to know the % of the viewers for each program. Excel: Adding a Calculated Field
First I need to add the field. In this case I add the sum of viewers again Excel: Adding a Calculated Field
Click on the new field and choose “Value Field Setting…” Excel: Adding a Calculated Field
Click on “Show Values As” • In the dropdown menu choose the calculation you want. • In this case “% of Column Total” • You can also set the Number Format Excel: Adding a Calculated Field
My pivot table now looks like: Excel: Adding a Calculated Field
My pivot table now looks like: Excel: Adding a Calculated Field
Fix the headings, add a few borders and it’s done Excel: Adding a Calculated Field
Download the Homework 6-18 and the Sales_data file. • Complete Homework 6-18. Rest of Today