Download
1 / 8
80 likes | 195 Vues
Economic Geography, Linkages and Low Carbon Economy. Economic Performance, Drivers and Comparisons John McCreadie – 6 th July 2010. Presentation Structure. Answering the Questions:

E N D
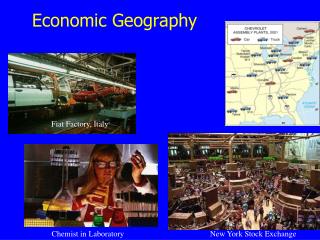
Economic Geography, Linkages and Low Carbon Economy Economic Performance, Drivers and Comparisons John McCreadie – 6th July 2010
Presentation Structure • Answering the Questions: • Which key sectors and sub-sectors have played the most important roles in driving employment and GVA growth in the City Region over the last decade? • How does the City Region compare with other, similar city regions, in the terms of its economic specialisms? • Are the high employment and GVA sectors of the recent past the ones which will drive economic change in the future?
Benchmarking Tyne and Wear City Region • TWCR employment growth has outperformed other northern CRs since 2000 (except Sheffield) • TWCR is most similar to Sheffield, Liverpool and Glasgow • Much higher rates of employment growth in Tourism; Digital and Creative; Financial, Professional and Business Services; and Public Sector • Employment in TWCR is more highly concentrated in Public Sector; Automotive; and Tourism
The Employment Gap • Over 33,500 jobs across 6 private service sectors are required to close the employment gap with the CR average • Increases to around 43,000 to close the gap with the national average • High levels of growth needed to achieve this e.g. Transport (+40%), Financial, Professional Business Services; and Digital and Creative (+20%)
Sectors Offering Opportunity • Identifying sectors with ability to bring money into TWCR • Three groups: • Private service sectors • Public Sector: sub-sectors not dependent on local demand • Industrial: stabilising manufacturing employment based on acknowledged strengths and market opportunities including Low Carbon • Account for c.20% of the total economy
Summary • City Region catch up driven by growth in private sector service economy • Further catch up required to match City Region peers • Financial and Professional Business Services are the most likely source of employment and GVA opportunities • Opportunities in Creative and Digital and Tourism