Download
1 / 70
700 likes | 962 Vues
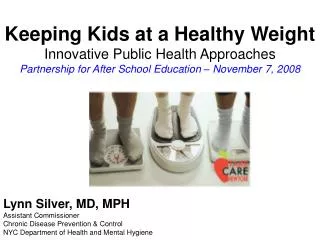
Keeping Kids at a Healthy Weight Innovative Public Health Approaches Partnership for After School Education – November 7, 2008. Lynn Silver, MD, MPH Assistant Commissioner Chronic Disease Prevention & Control NYC Department of Health and Mental Hygiene.

E N D
Keeping Kids at a Healthy WeightInnovative Public Health ApproachesPartnership for After School Education – November 7, 2008 Lynn Silver, MD, MPH Assistant Commissioner Chronic Disease Prevention & Control NYC Department of Health and Mental Hygiene
Obesity Trends* Among U.S. AdultsBRFSS, 1985 (*BMI ≥30, or ~ 30 lbs overweight for 5’ 4” person) No Data <10% 10%–14%
Obesity Trends* Among U.S. AdultsBRFSS, 1986 (*BMI ≥30, or ~ 30 lbs overweight for 5’ 4” person) No Data <10% 10%–14%
Obesity Trends* Among U.S. AdultsBRFSS, 1987 (*BMI ≥30, or ~ 30 lbs overweight for 5’ 4” person) No Data <10% 10%–14%
Obesity Trends* Among U.S. AdultsBRFSS, 1988 (*BMI ≥30, or ~ 30 lbs overweight for 5’ 4” person) No Data <10% 10%–14%
Obesity Trends* Among U.S. AdultsBRFSS, 1989 (*BMI ≥30, or ~ 30 lbs overweight for 5’ 4” person) No Data <10% 10%–14%
Obesity Trends* Among U.S. AdultsBRFSS, 1990 (*BMI ≥30, or ~ 30 lbs overweight for 5’ 4” person) No Data <10% 10%–14%
Obesity Trends* Among U.S. AdultsBRFSS, 1991 (*BMI ≥30, or ~ 30 lbs overweight for 5’ 4” person) No Data <10% 10%–14% 15%–19%
Obesity Trends* Among U.S. AdultsBRFSS, 1992 (*BMI ≥30, or ~ 30 lbs overweight for 5’ 4” person) No Data <10% 10%–14% 15%–19%
Obesity Trends* Among U.S. AdultsBRFSS, 1993 (*BMI ≥30, or ~ 30 lbs overweight for 5’ 4” person) No Data <10% 10%–14% 15%–19%
Obesity Trends* Among U.S. AdultsBRFSS, 1994 (*BMI ≥30, or ~ 30 lbs overweight for 5’ 4” person) No Data <10% 10%–14% 15%–19%
Obesity Trends* Among U.S. AdultsBRFSS, 1995 (*BMI ≥30, or ~ 30 lbs overweight for 5’ 4” person) No Data <10% 10%–14% 15%–19%
Obesity Trends* Among U.S. AdultsBRFSS, 1996 (*BMI ≥30, or ~ 30 lbs overweight for 5’ 4” person) No Data <10% 10%–14% 15%–19%
Obesity Trends* Among U.S. AdultsBRFSS, 1997 (*BMI ≥30, or ~ 30 lbs overweight for 5’ 4” person) No Data <10% 10%–14% 15%–19% ≥20%
Obesity Trends* Among U.S. AdultsBRFSS, 1998 (*BMI ≥30, or ~ 30 lbs overweight for 5’ 4” person) No Data <10% 10%–14% 15%–19% ≥20%
Obesity Trends* Among U.S. AdultsBRFSS, 1999 (*BMI ≥30, or ~ 30 lbs overweight for 5’ 4” person) No Data <10% 10%–14% 15%–19% ≥20%
Obesity Trends* Among U.S. AdultsBRFSS, 2000 (*BMI ≥30, or ~ 30 lbs overweight for 5’ 4” person) No Data <10% 10%–14% 15%–19% ≥20%
Obesity Trends* Among U.S. AdultsBRFSS, 2001 (*BMI ≥30, or ~ 30 lbs overweight for 5’ 4” person) No Data <10% 10%–14% 15%–19% 20%–24% ≥25%
Obesity Trends* Among U.S. AdultsBRFSS, 2002 (*BMI ≥30, or ~ 30 lbs overweight for 5’ 4” person) No Data <10% 10%–14% 15%–19% 20%–24% ≥25%
Obesity Trends* Among U.S. AdultsBRFSS, 2003 (*BMI ≥30, or ~ 30 lbs overweight for 5’ 4” person) No Data <10% 10%–14% 15%–19% 20%–24% ≥25%
Obesity Trends* Among U.S. AdultsBRFSS, 2004 (*BMI ≥30, or ~ 30 lbs overweight for 5’ 4” person) No Data <10% 10%–14% 15%–19% 20%–24% ≥25%
Obesity Trends* Among U.S. AdultsBRFSS, 2005 (*BMI ≥30, or ~ 30 lbs overweight for 5’ 4” person) No Data <10% 10%–14% 15%–19% 20%–24% 25%–29% ≥30%
Obesity Trends* Among U.S. AdultsBRFSS, 2006 (*BMI ≥30, or ~ 30 lbs. overweight for 5’ 4” person) No Data <10% 10%–14% 15%–19% 20%–24% 25%–29% ≥30%
Obesity Trends* Among U.S. AdultsBRFSS, 2007 (*BMI ≥30, or ~ 30 lbs. overweight for 5’ 4” person) No Data <10% 10%–14% 15%–19% 20%–24% 25%–29% ≥30%
Policy Approaches to Address Obesity • Obesity is not just a problem of the individual, but also a problem rooted in environmental and community factors • 2001 Surgeon General’s “Call to Action to Prevent and Decrease Overweight and Obesity” declared obesity a national priority SOURCES: U.S. DHHS, 2001; Galvez, Frieden & Landrigan, 2003
Obesity Begins EarlyOnly Half of NYC’s Elementary School Children Are at a Healthy Weight More than 4 in 10 are overweight or obese in Grades K-5
Among NYC Children in Head Start, 42% are Overweight or Obese SOURCE: DOHMH Vital Signs 2006; 5(2):1-2.
Childhood Obesity –Pattern for Life • Overweight children and adolescents are more likely to become obese as adults. • Approximately 80% of children who were overweight at aged 10–15 years were obese adults at age 25 years. • 25% of obese adults were overweight as children. • If overweight begins before 8 years of age, obesity in adulthood is likely to be more severe. http://www.cdc.gov/nccdphp/dnpa/obesity/childhood/
Health Implications (1) • Most widespread consequences of childhood obesity are psychosocial • Target of discrimination • Negative self-image (persistent to adulthood) • Decreased self-esteem (persistent to adulthood) • Lower health-related quality of life • Efforts to reduce stigma and discrimination need to be integrated in prevention or control interventions
Health Implications (2) • Multiple medical consequences of childhood obesity • Early maturation • Hyperlipidemia • Asthma • Glucose intolerance • Hypertension (less common) • Sleep apnea • Increased risk of adult fatness • Increases in truncal distribution of fat • Increased risk of eating disorders • Increased risk of cardiovascular disease & diabetes • Increased mortality risk
Bogalusa Heart Study, 1973-1994 • Community-based study of cardiovascular disease (CVD) risk factors in early life • Overweight children were: • 2.4 times more likely to have elevated total cholesterol • 4.5 times more likely to have elevated SBP • 12.6 times more likely to have high levels of fasting insulin • 60% of overweight children had at least one CVD risk factor compared to 10 percent of non-overweight children
What’s changed in so short a time? • Our gene’s? • Nope! • Our moral’s? • Hope Not! • Our physical activity amounts? • Just a little • Our calorie intake? • YES! 200 – 300 more calories a day
NYC Approaches to Battling Obesity • Policy • Daycare Regulations • Calorie Labeling • Design & Construction Guidelines (PENDING) • Public Procurement Guidelines • Environmental • Built Environment (Stairwells, Water Access, Construction) • Parks • Healthy Bodegas • Fruit & Vegetable Access • Community Programs • SPARK Shape Up, School PE • Food & Fitness Partnership • Daycare – Eat Well Play Hard (FSNE) • Fitnessgram for school children • HealthTrak in daycares
NYC Health Code – Daycare Regulations • On Nutrition, Physical Activity and TV Viewing.
Day Care:Nutrition Standards Provide guidance on: • Appropriate kinds of foods & beverages • Promote water • Limit juice to 6 oz/day • No sugar sweetened beverages • 1% milk only after age 2 • Appropriate portion sizes for children • Remaining consistent with federal CACFP policy for meal & snack reimbursement SOURCES: Child and Adult Care Food Program; U.S. Dietary Guidelines for Americans, 2005
Day Care:Physical Activity Standards • Required minimum physical activity minutes daily: • For ages 12 mos. and up, at least 60 min./day • For ages 3 and older, at least 30 min. of that time must be structured & guided activity • Young children should not be sedentary for more than 60 min. consecutively, except when sleeping • In inclement weather, safe, active indoor play shall be substituted for outdoor play SOURCES: CDC; National Association for Sport and Physical Education
Day Care:TV Viewing Standards • TV Viewing limited: • Maximum of 1 hr./day • Educational programs only SOURCES: CDC; National Association for Sport and Physical Education
Daycare Implementation/Support • SPARK training in early childhood settings citywide • Nutrition training efforts • Eat Well Play Hard (FSNE) training kids, parents & staff • To day care inspectors • To nutrition staff in community through Bureau of Daycare • Educational materials disseminated to children and parents through daycare staff
SPARK!Physical Activity for Children • Since 2003, DOHMH has partnered with the Sports, Play and Active Recreation for Kids! (SPARK!) program • Goal – train and equip all daycare centersschools, K-2 teachers, and as many after-schools as possible in the highest risk communities, and then citywide • To date SPARK training and equipment has reached: • Daycare:8,226 daycare staff trained @ 1219sites • School Based Pre-K: 1584 staff trained @ 464 sites • After School Programs: 747 participants trained @ 175 sties
Food Procurement Task Force • All city agencies procuring food are represented on the task force. • Focus is on nutrition standards within city agencies (including school system) specifically regarding: concessions, vending machines, and food contracts. • Nutrition Guidelines released by Mayor: September 2008.
Over 225 Million Meals and Snacks Served by City Agencies per year Number of snacks served (in millions): DHS: .27 DYCD: .19 DOE: 9.9 DOC: .39
Highlights from Procurement Guidelines • Beverages • ≤ 25 calories per 8 oz for beverages other then 100% juice or milk • NO SUGAR SWEETENED SODA! • Juice must be 100% fruit juice (limited to ≤ 8 oz) • Milk must be 1% or non-fat • Food • Minimum of 2 servings of fruits & vegetables for lunch and dinner • Elimination of deep fryers – no deep frying allowed!
Eating Out Is Associated with Obesity • ~1/3 of our calorie intake comes from food prepared outside the home • Eating out is associated with higher calorie intake and obesity • Children eat almost twice as many calories in restaurant meals compared to meals at home (770 vs. 420 calories) Guthrie JF et al., 2002 & Zoumas-Morse C, Rock CL, Sobo EJ, Meuhouser ML. , 2001
Increasing Calories in Fast Food 1977-19781994-1996 419 497 171 284 191 131 972 721 Increase of 251 calories (35%)
Calorie Labeling in NYC • Consumers underestimate calories in restaurant food and over consume • Availability of calorie information leads to healthier choices