PRESENT WORTH ANALYSIS Chapter 5
PRESENT WORTH ANALYSIS Chapter 5. BANK LOAN VS INVESTMENT PROJECT. Present - Worth Analysis. Initial Project Screening Methods Present-Worth Analysis Methods to Compare Mutually Exclusive Alternatives.

PRESENT WORTH ANALYSIS Chapter 5
E N D
Presentation Transcript
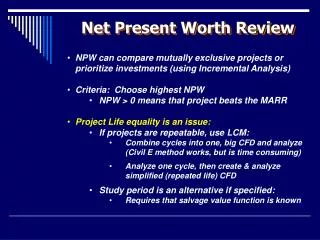
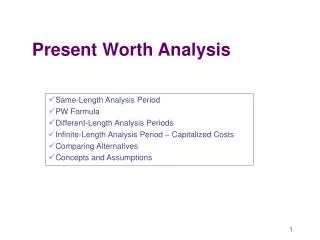
Present - Worth Analysis • Initial Project Screening Methods • Present-Worth Analysis • Methods to Compare Mutually Exclusive Alternatives
INITIAL PROJECT SCREENING METHODOne of the primary concerns of the most business people is whether, and when, the money invested in a project can be recovered. The payback method screens projects on the basis of how long it takes for net receipts to equal investment spending. • Principle:How fast can I recover my initial investment? • Method: Based on cumulative cash flow. • Screening Guideline: • If the payback period is less than or equal to some specified payback period, the project would be considered for further analysis. • Weakness: • Does not consider the time value of money
Example 5.1 Conventional Payback Period(Learning curve method: 50% savings in year 1, 75% savings in year 2) NCash FlowCum. Flow 0 1 2 3 4 5 6 7 -$1,800,000 $454,000 $681,000 $908,000 $908,000 $908,000 $908,000 $1,268,000 -$1,800,000 -$1,346,000 -$665,000 $243,000 $1,151,000 $2,059,000 $2,967,000 $4,235,000 Payback period should occur somewhere between N = 2 and N = 3.
Figure 5 – 2 Illustration of conventional payback period – (a) annual project cash flow over the life of the project and (b) cumulative project cash flows over time
DISCOUNTED PAYBACK PERIOD • We consider the time value of money – that is, the cost of funds (interest) used to support project. • Inother words, we define the discounted-payback period as the number of years required to recover the investment from discounted cash flows.
Example 5.2 Discounted Payback PeriodGiveni=15%, Find: Discounted-payback period PeriodCash Flow Cost of Funds (15%) Cum. Flow 0 1 2 3 4 5 6 7 -$1,800,000 454,000 681,000 908,000 908,000 908,000 908,000 1,268,000 0 -1,800,000 (0.15) = - 270,000 -1,616,000 (0.15) = - 242,000 -1,177,400 (0.15) = - 176,610 - 446,010 (0.15) = - 66,902 395,089 (0.15) = 59,263 1,362,352 (0.15) = 204,353 2,474,705 (0.15) = 371,206 • -$1,800,000 • -1,616,000 • -1,177,400 • 446,010 • 395,089 • 1,362,352 • 2,474,705 • $4,113,911 Payback period should occur somewhere between N = 3 and N = 4.
Net – Present – Worth Criterion NPW Evaluation of a single project Step 1:Determine the interest rate that the firm wishes to earn on its investments. Firm always invest the money in its investment pool. This interest rate often referred to required rate of return or a minimum attractive rate of return (MARR). Usually this selection is a policy decision made by the top management. Step 2: Estimate the service life of a project. Step 3: Estimate the cash inflow for each period over the service life. Step 4: Estimate the cash outflow for each period over the service life. Step 5: Determine the net cash flow for each period net cash flow = cash inflow – cash outflow
Step 6: Find the present worth of each net cash flow at the MARR. Add up these present worth figures; their sum is identified as the project’s NPW. Step 7: In this context, a positive NPW means that the equivalent worth of the inflows is greater than the equivalent worth of outflows so that the project makes a profit. • If PW( i ) > 0, accept the investment. • If PW(i) = 0, remain indifferent to the investment • If PW( i) < 0, reject the investment
PW(i) > 0 Net Present Worth (NPW) Measure • Principle: Compute the equivalent net surplus at n= 0 for a given interest rate of i. • Decision Rule: Accept the project if the net surplus is positive. Inflow 0 1 2 3 4 5 Outflow Net surplus PW(i) inflow 0 PW(i) outflow
Example 5.3 Net Present Worth – Uneven Flows Given: MARR = 15% Find: NPW End of year Cash Flow 0 1 2 3 4 5 6 7 -$1,800,000 $454,000 $681,000 $908,000 $908,000 $908,000 $908,000 $1,268,000
Figure 5-4 Calculating the net present value of the Multi-Tasking machine
Figure 5-7 The concept of the investment pool, with the company as a lender and the project as a borrower
Capitalized Equivalence Fund • Consider the situation when the life of the project is very long (say 40 years or more) such as many public projects such as bridges, dams, irrigation system etc. • How do we determine PW of such projects? • The process of computing PW for an infinite series of equal payment is calledCapitalization
Revenue Projects generate revenues that depend on the choice of alternative that we want to select the alternative with the largest net gains Service Projects generate revenues that do not depend on the choice of project, but must produce the same amount of output (revenue) with lower production cost.
Analysis Period is the time period over which the economic effects of an investment will be evaluated. • The study (analysis) period, sometimes called the planning horizon, is the selected time period over which Mutually Exclusive alternatives are compared. • Factors influence the decision are; • the required service period, • the useful life of the shorter lived alternative, • the useful life of the longer lived alternative, • company policy. • Consider Analysis period to be Required Service Period. • One convenient choice of analysis is the period of the useful life of the investment project.
For revenue projects, we select the one with largest NPW, so producing product B is more economical
Comparing Mutually Exclusive Projects Case 1: Project lives longer than the analysis period (Example 5.7) Case 2: Project lives shorter than the analysis period (Example 5.8)
Example 5.7 Present Worth Comparison Case 1: Project lives longer than the analysis period • Allan company got the permission to harvest southern pines from one of the timberland area. They are considering purchasing a machine, which has the ability to hold, saw, and place trees in bunches to go down to the landing area. The operation on this timberland area must be completed in three years. Allan company could speed up the operation, but doing so is not desirable, as the market demand of the timber does not justify such speed. There are two possible models of machines that Allan could purchase for this job: Model A is a two year old used equipment, where as Model B is a brand new machine.
Example 5.7 Present Worth Comparison continue …… • Model A costs $205,000 and has a life of 10,000 hours before it will require any major overhaul. The operating cost will run $50,000 per year for 2,000 hours of operation. At this operational rate, the unit will be operable for five years, and at the end of that time it is estimated that the salvage value will be $75,000. • The more efficient Model B costs $275,000, has a life of 14,000 hours before requiring any major overhaul, and cost $32,500 to operate for 2,000 hours per year in order to complete the job within three years. The estimated salvage value of Model B at the end of seven years is $95,000.
Since the life of either model exceeds the required service period of three years, Allan company has to assume some things about the used equipment at the end of that time. Therefore, the engineers at Allan estimate that, after three years, the Model A unit could be sold for $130,000 and Model B unit for $180,000. • Assume the firm’s MARR is 15%, which option is more acceptable?
Case 1: Project life is longer than the analysis period (Example 5.7) Figure 5-11 (a) If models are not sold after the required service period;
Case 1: Project life is longer than the analysis period (Example 5.7) Figure 5-11 (b) If models are not sold after the required service period;
SOLUTION PW (15%) = -$205,000 - $50,000 (P/A, 15%, 3) + $130,000 (P/F, 15%, 3) (A)= -$205,000 - $50,000 (2.2832) + $130,000 (0.6575) = -$205,000 – $114,160 + $85,475 =-$233,685
SOLUTION PW (15%) = -$275,000 - $32,500 (P/A, 15%, 3) + $180,000 (P/F, 15%, 3) (B)= -$275,000 - $32,500 (2.2832) + $180,000 (0.6575) = -$275,000 – $74,204 + $118,350 =-$230,854
Conclusion SOLUTION PW (15%) = -$205,000 - $50,000 (P/A, 15%, 3) + $130,000 (P/F, 15%, 3) (A)= -$205,000 - $50,000 (2.2832) + $130,000 (0.6575) = -$205,000 – $114,160 + $85,475 =-$233,685 PW (15%) = -$275,000 - $32,500 (P/A, 15%, 3) + $180,000 (P/F, 15%, 3) (B)= -$275,000 - $32,500 (2.2832) + $180,000 (0.6575) = -$275,000 – $74,204 + $118,350 =-$230,854 Model B is cheaper to operate and therefore, would be preferred.
Example 5.8 Present Worth Comparison Case 2: Project life is shorter than the analysis period Phoenix Manufacturing Company is planning to modernize one of its distributions located outside Denver, Colorado. Two options to move goods in the distribution center have been under consideration: A conveyor system and forklift trucks. The firm expects that the distribution center will be operational for the next 10 years, and then it will be converted into factory outlet. The conveyor system would last eight years, whereas the forklift trucks would last only six years. The two options will be designed differently, but will have identical capacities and will do exactly the same job. The expected cash flows for the two options, including maintenance costs, salvage values are as follows.
With this scenario, which option should the firm select at MARR = 12%
SOLUTION • Since each option has a shorter life than the required service period (10 years), we need to make explicit assumption of how the service requirement is to be met. • If the company goes with conveyor system, it will spend $18,000 to overhaul the system to extend its service life beyond eight years. The expected salvage value of the system at the end of the required service period (10 years) will be $6,000. The annual operating and maintenance costs will be $13,000.
SOLUTION • If the company goes with the lift truck option, the company will consider leasing a comparable lift truck that has annual lease payment of $8,000,payable at the beginning of each year, with an annual operating cost of $15,000 for the remaining required service period. • The anticipated cash flows for both models under this scenario are shown in the tables describing the cash flows associated with each option. Note that both alternatives now have the same required service period of 10 years.
PW (12%) Conveyor = - $68,000 - $13,000 (P/A, 12%, 10) - $18,000 (P/F, 12%, 8) + $6,000 (P/F, 12%,10) PW (12%) Conveyor = - $146,791
PW (12%) Lift Trucks = - $40,000 - $15,000 (P/A, 12%, 10) - $8,000 (P/A, 12%, 4) (P/F, 12%, 5) + $4,000 (P/F, 12%,6) PW (12%) Lift Trucks = -$136,514 Since these projects are service projects, the lift truck option is better choice.
QUESTION # 1 You are considering the purchase of another office building close to your existing office building. The building is a 10-year old structure with an estimated remaining service life of 20 years. The tenants have recently signed long-term leases, which leads you to believe that the current rental income of $200,000 per year will remain constant for the first five years. Then the rental income will increase by 20% for every five-year interval over the remaining asset life. Thus, the annual rental income would be $240,000 for years 6 through 10, $288,000 for years 11 through 15, and $345,600 for years 16 through 20. You estimate that operating expenses will be $50,000 for the first year and that they will increase by $10,000 each year thereafter. You estimate that completely destroying the building and selling the lot on which it stands will realize a net amount of $250,000 at the end of the 20th year. If you had the opportunity to invest your money elsewhere and thereby earn interest at the rate of 15% per year, what would be the maximum amount you would be willing to pay for the building at the present time?
SOLUTION # 1 Let A0 be the maximum investment requirement to break even. PW(15%) = - A0 + $200,000 (P/A, 15%, 5) + $240,000 (P/A, 15%, 5) (P/F, 15%, 5) + $288,000 (P/A, 15%, 5) (P/F, 15%, 10) + $345,600 (P/A, 15%, 5) (P/F, 15%, 15) - $50,000 (P/A, 15%, 20) – 10,000 (P/G, 15%, 20) + $250,000 (P/F, 15%, 20) PW(15%) = - A0 + $200,000 (3.3522) + $240,000 (3.3522) (0.4972) + $288,000 (3.3522) (0.2472) + $345,600 (3.3522) (0.1229) - $50,000 (6.2593) – 10,000 (33.5822) + $250,000 (0.0611) PW(15%) = - A0 + $670,440 + $400,011 + $238,655 + $142,382 - $312,965 - $335,822 + $15,275 PW(15%) = -A0 + $1,466,763 - $648,787 = 0 A0= $817,976
QUESTION # 2 A large food-processing corporation is considering using laser technology to speed up and eliminate waste in the potato-peeling process. To implement the system, the company anticipates needing to purchase the industrial-strength lasers. The system will save $1,000,000 per year in labor and materials. However, it will incur an additional operating and maintenance cost of $200,000 per year. The system is expected to have a 10-year service life and a salvage value of about $100,000. If the company's MARR is 15%, determine the maximum price that the company should pay to purchase the industrial-strength lasers so that project is profitable. NPW = -I + 100,000 (P/F, 0.15, 10) + 800,000 (P/A, 0.15, 10) = -I + 100,000*5.0188 + 800,000*0.2472 = -I + 4,039,750 ≥0 => I ≤$4,039,750 The company should pay ≤ $4,039,750 so that the project is profitable with MARR of 15%.
QUESTION # 3 A bi-level mall is under construction. Installation of only 10 escalators is planned at the start although the ultimate design calls for 16. The question arises whether to provide necessary facilities that would permit the installation of the additional escalators (e.g., stair supports, wiring conduits, and motor foundations) at the mere cost of their purchase and installation now or to defer investment in these facilities until the escalators need to be installed. The two options are detailed as follows: Option 1: Provide these facilities now for all six future escalators at $250,000. Option 2: Defer the investment as needed. Installation of two more escalators is planned in three years, two more in seven years, and the last two in ten years. The installation of these facilities at the time they are required is estimated to cost $100,000 in year 3, $120,000 in year 7, and $140,000 in year 10. For both options, additional annual expenses are estimated at $2,000 for each escalator facility installed. Assume the company's MARR is 15%.
SOLUTION # 3 PW1 = -250,000 – 12,000 (P/A, 0.15, 10) = -250,000 -12,000 * 5.0188 = -$310,225.6 PW2 = -100,000 (P/F, 0.15, 3) – 4000 (P/A, 0.15, 7)(P/F, 0.15, 3) -120,000 (P/F, 0.15, 7) – 4000 (P/A, 0.15, 3)(P/F, 0.15, 7) -140,000 (P/F, 0.15, 10) = -100,000*0.6575 – 4000*4.1604*0.6575 -120,000*0.3759 – 4000*2.2832*0.3759 – 140,000*0.2472 =$-159,840.872 Since the cost of Option 2 is less, then Option 2 is a better choice.


![Engineering Economy [5-1] Present Worth Analysis Instructor: Eng. Tamer Haddad](https://cdn3.slideserve.com/5923041/engineering-economy-5-1-present-worth-analysis-instructor-eng-tamer-haddad-dt.jpg)
![Engineering Economy [5-1] Present Worth Analysis Reema Bdair Nassar](https://cdn3.slideserve.com/5923046/engineering-economy-5-1-present-worth-analysis-reema-bdair-nassar-dt.jpg)