Download
1 / 23
230 likes | 257 Vues
Learn how companies evaluate project alternatives using present worth analysis, comparing revenue and service projects over equal and different life spans, with examples and calculations.

E N D
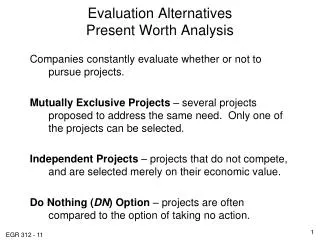
Evaluation AlternativesPresent Worth Analysis Companies constantly evaluate whether or not to pursue projects. Mutually Exclusive Projects – several projects proposed to address the same need. Only one of the projects can be selected. Independent Projects – projects that do not compete, and are selected merely on their economic value. Do Nothing (DN) Option – projects are often compared to the option of taking no action.
Present Worth Analysis Project Types: Revenue – each alternative project being evaluated generate costs and revenues. These alternatives usually involve the purchase of new systems and equipment in order to increase revenue. Both the cost streams and revenue streams vary by alternative. Service – Each alternative has only cost cash flow estimates. These projects are typically for safety, or are government mandated projects.
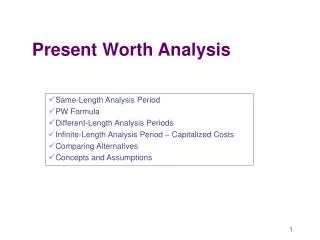
Present Worth Analysis – Equal Life Alternatives One alternative – Calculate the present worth (PW) at the MARR. If PW > 0, the requested MARR is met or exceeded and the alternative is financially viable. Two or more alternatives – calculate the PW of each alternative at the MARR. Select the alternative with the PW value that is numerically largest. (If all PW are negative, and do nothing is an alternative, then do nothing.)
Present Worth Analysis – Equal Life Alternatives Revenue Example: You are evaluating the purchase of a two income properties. You expect a MARR of 15%. You have enough funds for both purchases. $75K Home$37.5K Home Purchase Price $15,000 $ 7,500 Annual Maint. $ 6,000 $ 4,000 Annual Income $ 7,500 $ 5,000 Resale (after Expenses) $90,000 $40,000 Life, years 15 15
Present Worth Analysis – Equal Life Alternatives $75K Home PW = -$15,000 +1500(P/A,15%,15) + $90,000(P/F,15%,15) PW = $4832 $37.5K Home PW = -$7,500 + $1000(P/A, 15%,15) + $40,000(P/F,15%,15) PW = $3263 What if 8% MARR was used? PW ($75K Home) = $26,207 PW ($37.5K Home) = $13,667
Present Worth Analysis – Equal Life Alternatives Service Example: You are evaluating the purchase of a new or used car that needs to last you for only 5 years. New CarUsed Car Purchase Price $20,000 $10,000 Annual Maint. $ 500 $ 1,000 Resale Value $ 8,000 $ 4,000 Life, years 5 5
Present Worth Analysis – Equal Life Alternatives Use 8% for i since 8% is the expected rate of return if money invested in stock market rather than purchasing a vehicle. New Car PW = -$20,000 - $500(P/A,8%,5) + $8000(P/F,8%,5) PW = -$16,552 Used Car PW = -$10,000 -$1000(P/A,8%,5) + $4,000(P/F,8%,5) PW = -$11,270
Present Worth Analysis – Different Life Alternatives The Present Worth of alternatives must be compared over the same number of years. If project alternative have different service lives, the equal service requirement can be satisfied by: • Compare the alternative over a period of time equal to the least common multiple (LCM) of their lives. • Compare the alternative using a study period of length n, which does not necessarily take into consideration the useful lives of the alternatives. This period n is called the planning horizon.
Present Worth Analysis – Different Life Alternatives Revenue Example: You are evaluating the upgrade of some production equipment to increase productivity. You are considering two alternatives. Company policy dictates a MARR of 20%. Alternative 1Alternative 2 Purchase Price $ 200,000 $100,000 Annual Maint. $ 5,000 $ 2,000 Productivity Imp. (per year) $ 40,000 $ 20,000 Life, years 10 12
Present Worth Analysis – Different Life Alternatives Revenue Example: Because life alternatives are different, you decide to use a 10 year planning horizon and estimate a resale value of alternative of $5000 for the remaining 2 year of life. Alternative 1 PW = -$200,000 + $35,000(P/A,20%,10) PW = -$53,262 Alternative 2 PW = -$100,000 + $18,000(P/A,20%,10) + 5000(P/F,20%,10) PW = -$23,727 Which alternative should you choose? Do nothing.
Present Worth Analysis – Different Life Alternatives Service Example: You are evaluating the purchase of a new or used cars that needs to last you for 10 years. New CarUsed Car Purchase Price $20,000 $10,000 Annual Maint. $ 750 $ 1,000 Resale Value $ 4,000 $ 4,000 Life, years 10 5
Present Worth Analysis – Different Life Alternatives Use 8% for i since 8% is the expected rate of return if money invested in stock market rather than purchasing a vehicle. New Car PW = -$20,000 - $750(P/A,8%,10) + $4000(P/F,8%,10) PW = -$23,180 Used Car Buy used car in year 0 Buy used car in year 5 Sell car in year 5 PW = -$10,000 + $4,000(P/F,8%,5) -$10,000(P/F,8%,5) + $4000(P/F,8%,10) -$1000(P/A,8%,10) PW = -$18,941
Future Worth Analysis Future worth analysis is similar to present worth analysis, expect that all cash flows are normalized to some future point in time. Future worth is often used if an asset is to be sold at some future point in time, but before its expected life is reached. The future worth would be an indicator of how much the asset could be sold for at that future point in time (of course this assumes the buyer expects the same cash flows you anticipate).
Future Worth Analysis Example: A company is considering selling off its power generation plants in 5 years. The cash flow projection over the next 5 years for this power generation operation unit is depicted below. What sales price in year 5 (future worth)must be received to achieve the company’s ROR of 15% per year. FW = -$60(F/P,15%,4) + $25(F/P,15%,3) + $50(F/P,15%,2) + $75(F/P,15%,1) + $50 $FW $75 $50 $50 $25 0 1 2 3 4 5 6 7 8 $60
Capitalized Cost Capitalized cost (CC) is the present worth of an alternative that will last “forever”. Examples include University endowments, and large public sector projects (dams, bridges, tollroads, etc.). CC is related to P/A formula: P = A(P/A,i%,inf.) As n approaches infinity, CC = A/i. This result should make common sense. For example if an endowment was invested at 10% interest, and $1000 was to be withdrawn every year indefinitely, then $1000/.1 = $10,000 must be the present amount in the endowment.
Capitalized Cost The following examples demonstrates how to obtain the capitalized cost of an asset which contains both recurrent and non-recurrent cash flows. A toll-road was just completed at a cost of $1.5 billion, with major maintenance expenditures of $500 million forecast every 10 years. Annual receipts minus maintenance results in a positive cash flow of $150 million. What is the present worth, assuming i = 5%? $150 $150 0 1 2 3 4 5 6 7 8 9 10 11 … 20 $500 $1500
Capitalized Cost $150 $150 $150 … … 0 1 2 3 4 5 6 7 8 9 10 11 … 20 ….. 1) Distribute the $500million every 10 years to an annual cost. A1 = -$500(A/F, 5%,10) = -$39.75 million. Therefore AT = $110.25 million. 2) CC = -$1,500 + 110.25/.05 = $705 million $500 $1500
Payback Period Analysis The payback period, np, is the estimated time, usually in years, it will take for the estimated revenues and other economic benefits to recover the initial investment and a stated rate of return i. In other words, find np that satisfies the following equation: Or if all end of year cash flows are equal, where NCF is the net cash flow in period t, and DP is the initial downpayment or cash flow at time 0
Payback Period Analysis Example: A pharmaceutical company anticipates R&D cost of $1.5 Billion for the development of a new drug. In addition, production startup costs are estimated at $1.0 Billion. Annual marketing costs are expected to be $50 million, annual production costs are $100 million, and annual sales are expected to be $500 million. What is the payback period for an ROR of 10%? DP = $2,500 Million A = $350 million $2,500 = $350(P/A, 10%,n) (P/A,10%,n) = 7.14 n = 13.1
Payback Period Analysis Caution: Payback period does not necessarily indicate one alternative being preferable to another alternative. Example: Using ROR of 15% Machine 1 Machine 2 DP = $12,000 $8,000 Annual NCF = $3000 $1000 (year 1-5) $3000 (year 6-14) Max Life 7 14 (years)
Payback Period Analysis Example: Machine 1 0 = -$12,000 + $3000(P/A,15%,np) np = 6.57 Machine 2 0 = -$8,000 + $1000(P/A,15%,5) + $3,000(P/A,15%,np-5)(P/F,15%,5) np = 9.52 Using LCM of 14 years. PW 1 = -$12,000 - $12,000(P/F,15%,7) + $3000(P/A,15%,14) = $663 PW 2 = -$8,000 + $1000(P/A,15%,5) + $3000(P/A,15%,9)(P/F,15%,5) = $2470
Life Cycle Cost (LCC) LCC analysis is the present worth (PW) of an alternative at a stated MARR, covering all costs from the early stages of design through the final stages of phase-out and disposal. Example: A pharmaceutical company anticipates R&D cost of $1.5 Billion for the development of a new drug. In addition, production startup costs are estimated at $1.0 Billion. Annual marketing costs are expected to be $50 million, annual production costs are $100 million, and annual sales are expected to be $500 million. At the end of production, the plant and equipment can be sold for $100 million. This drug is to be phased out after 20 years. What is the LCC assuming a 10% MARR.
Life Cycle Cost (LCC) Example: A pharmaceutical company anticipates R&D cost of $1.5 Billion for the development of a new drug (in years 1&2). In addition, production startup costs are estimated at $1.0 Billion (in year 3&4). Annual marketing costs are expected to be $50 million, annual production costs are $100 million (both starting in year 5). At the end of production, the plant and equipment can be sold for $100 million (year 24). This drug is to be phased out after 20 years of production. What is the LCC assuming a 10% MARR. (in millions) PW = $750(P/F,10%,1) + $750(P/F,10%,2) + $500(P/F,10%,3) + $500(P/F,10%,4) + $150(P/A,10%,20)(P/F,10%,4) - $100(P/F,10%,24)