SCIENTIFIC MEASUREMENT
120 likes | 211 Vues
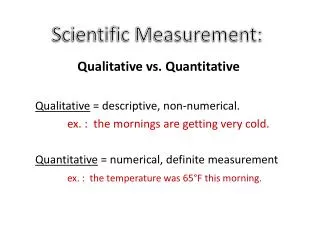
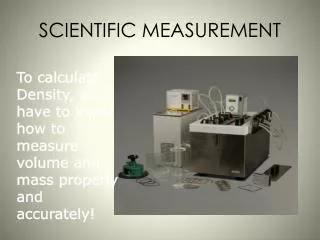
Learn scientific measurement techniques for accurate and reliable data recording. Understand the importance of significant figures and reading measured numbers for reproducibility. Explore data collection methods and experimenting for fair tests. Enhance skills in data graphing and interpretation for sustainable development.

SCIENTIFIC MEASUREMENT
E N D
Presentation Transcript
Science 10 ACSC Data Recording Skills SCIENTIFIC MEASUREMENT On Target with ACCURACY and Reliability
CONCEPT MAP Sustainable Development Overview
OVERVIEW: Data Recording Skills • A- ACCURACY AND RELIABILITY • B- Recording Measured Numbers • C- Reading Measured Numbers • D- How Much Data is Enough • E- Experimenting ACSC Skill Outcomes: 214-5, 214-8, 214-10, 215-2
A-Accuracy and Reliability • This animation may give the impression of 100% accuracy and 100% reliability However real data is not like that. • Real data always has experimental error. (uncertainty NOT mistake)
B-Recording Measured Numbers“Significant Figures”Features & Benefits skip to end -> Features, “Significant Figures” include the following: • All accurately known digits are recorded • One digit with opinion is recorded, (estimate tenths in the smallest graduation) • Counted and defined numbers have infinite significance. Benefits • Accurately recorded digits give clues to the reliability and reproducibility of the data.
C-Reading Measured Numbers“Significant Figures”Features & Benefits skip to end -> Features, “Significant Figures” examples: • All nonzero digits are significant • Counted and defined numbers have infinite significance. • Zeros, which ones are significant and which are just space holders? Benefits Accurately read digits preserve the validity and reproducibility of the data.
D-Data Collection: How much data is enough? Skip to end-> • Test (Practice, until the trials are “fair tests.” (trials must be comparable and consistent) • Test (Experimental Bias: method/experimenter introduced trends) Practice the method until method biases or the lack of them become obvious. • Test (Trends) collect data until trends or lack of them become obvious.
E- Experimenting skip to end-> • There are several practical things which can be done to control variables for a fair test. • Do all trials, to be compared, on the same day. • Manipulate or change only one variable. • Practice until you can collect reliable data that is, the tests are fair. • Use the same method being careful to do everything exactly the same to collect the data. • Scientific attitudes are important. They dictate accuracy clarity and soundness of scientific arguments.
E-Data Graphing:What does the shape and graph distribution tell you? Skip to end-> • Plot the test data on the graph to see how well the actual trials fit in the corridor of success . • Look for trends or the lack of them suggested by the shape of the graph. • If you had to hit a target accurately are some angles better to shoot from? How is this indicated by the corridor of success? • In this case is more reliable likely to be more accurate? • Graphing for CLARITY
Internet Availability • Science 10 ACSC development site http://scifair.ednet.ns.ca/science10 • Central Kings Science 10 <http://scifair.ednet.ns.ca/CKCLS/index~PHS.html> Review Buttons (Accuracy and Reliability) Recording Measured Numbers (Significant figures) Reading Measured numbers Data Collection (How much is enough?) Experimenting
Prediction: Corridor of Success Back-> • The experimental max./min. air times were added to the spreadsheet. • Then the graph will update to show the expected minimum and maximum range of the projectile.