Understanding Expected Value and Standard Error in Box Models
90 likes | 234 Vues
This guide explores the concepts of Expected Value (EV) and Standard Error (SE) using box models and practical examples. It covers various scenarios, including coin tosses and die rolls, to illustrate how to calculate EV and SE from draws with replacement. By analyzing expected outcomes, such as getting a certain number of successes in repeated trials, we can understand the likely variability in results. Key examples demonstrate how to apply these statistical tools in real-world situations, aiding in probability assessment and data interpretation.

Understanding Expected Value and Standard Error in Box Models
E N D
Presentation Transcript
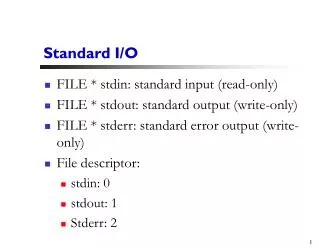
Ch. 17 The Expected Value & Standard Error • Review box models • Examples • Pigs – assume 40% chance of getting a “trotter” • 20 tosses • Coin toss – 20 times • Roll die – 10 times • Roll die and count number of 5’s – 10 times
Expected Value (EV) • The expected value for a sum of draws made at random with replacement from a box equals (# of draws)x(average of box). • Pigs: EV=(20)(4/10)=8 • Coin toss: • 10 die rolls: • 10 die rolls and count # of 5’s:
Standard Error (SE) • Sum = Expected Value + Chance Error • Standard error is how large the chance error is likely to be. • The sum of draws within 1 SE of EV is approximately 68% of the data. • The sum of draws within 2 SE of EV is approximately 95% of the data. • The sum of draws within 1 SE of EV is approximately 99.9% of the data.
SE for sum = square root(# of draws)xSDbox • Example 1: Coin toss 20 times and let the sum be the number of heads. • Find the SE of the sum. • Find the average of the box • Find the SD of the box • Find the SE of the sum • Fill in the blanks: The number of heads in 20 coin tosses is likely to be ___ give or take ___ or so.
Example 2: 10 die rolls • Find the average of the box • Find the SD of the box • Find the SE of the sum • The sum of 10 die rolls is likely to be ___ give or take ___ or so.
Example 3: (A shortcut for boxes with only 2 kinds of tickets.) Roll a die 10 times and count the # of 5’s. • SD = • SE = • The number of 5’s in 10 die rolls is likely to be around ___ give or take ___.
Using the normal table • Way to generalize a large number of draws with replacement. • Calculate the EV & SE for sum of draws • Repeat many times • Make a histogram of the sums
Example 4: 100 draws with replacement from 1, 2, 3. Smallest sum = Largest sum = Average = EV = SD of box = SE of sum = We expect the sum of 100 draws to be ____ give or take ____.
If we repeat this scenario many times, what percent of the time will the sum be above 220? (In other words, what is the probability of getting a sum greater than 220?)