Download

1 / 64
660 likes | 841 Vues
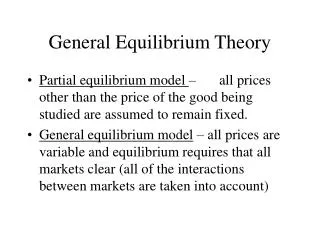
General Equilibrium. INTRODUCTION. In this chapter we will deal with positive economy theory to construct a framework for the following purposes ; First ; predicting the effect of particular cause ; Second ; detecting the cause of particular effects ;

E N D
General Equilibrium Walters & Layard CH 2
INTRODUCTION In this chapter we will deal with positive economy theory to construct a framework for the following purposes ; First ; predicting the effect of particular cause ; Second ; detecting the cause of particular effects ; A simple model is chosen ; two sector model ; This chapter has also two independent purposes; 1- we prove the existence and stability of general competitive equilibrium and consider whether it is unique ? 2 –how distribution of income is determined and how it would change with changes in factor supply ; Walters & Layard CH 2
CONSUMPTION WITHOUT PRODUCTION PURE EXCHANGE oB Y E o uB A- Bargaining ; E = initial endowment point → MRSxyA > MRSxyB → fruitful trade is possible . As while as both are consuming in the ET0T1 area , both will be better off . The solution will be any point between T0 and T1 on the contract curve . If solution would be near to T0 , individual A has more strength ,and vise versa . T0 uA T1 oA X Walters & Layard CH 2
CONSUMPTION WITHOUT PRODUCTION PURE EXCHANGE B- Existence of equilibrium We will deal with competitive equilibrium , in which there are large number of identical consumers with identical utility functions and identical endowments. The presence of auctioneer who will call on different prices will finally bring about the equilibrium point like T. There are three question that are of interest to the auctioneer. 1-First , is there any price which could clear the market ? Does equilibrium exist ? 2-Second , is there more than one such price ? Is equilibrium unique ? 3-Third, will the equilibrium be stable ? Walters & Layard CH 2
CONSUMPTION WITHOUT PRODUCTION PURE EXCHANGE Suppose auctioneer starts with price equal to the slope of ET0 , ( price = p0) . a’ b’ oB Y E d’ d c’ cB cA T0 c p0 C P* a b oA X Walters & Layard CH 2
CONSUMPTION WITHOUT PRODUCTION PURE EXCHANGE Consumer A ; Consumer B ; ab= excess demand for x a’b’ =excess supply of x cd = excess supply for y c’d’ = excess demand for y ab > a’b’ → aggregate excess demand for x → (px/py)↑ cd > c’d’ → aggregate excess supply for y → (px/py)↑ Price line E T0 rotates around E inward until CA and CB coincide with each other. When CA and CB coincide with each other at point C , excess demand for x and excess supply of y becomes zero . The price line will be equilibrium price ( P* ), and MRSxyA=MRSxyB,. We will be on the contract curve . This process could be repeated for any other price other than the equilibrium price (p* ) , until we reach to equilibrium price . What is clear from this analysis is that at any price level both consumers will be on their budget constraint. Walters & Layard CH 2
CONSUMPTION WITHOUT PRODUCTION PURE EXCHANGE It is clear from this analysis that at any price level both consumers will be on their budget constraint. This is what we expect from consumer utility maximization under perfect competition; pxxA + pyyA =value of A’s market demand = A’s expenditure pxxoA + pyyoA = value of A’s market supply = A,s income xoA = initial endowment of x for individual A yoA = initial endowment of y for individual A pxxA+pyyA = pxxoA + pyyoA → px(xA – xoA) + py(yA – yoA) = 0 pxxB+pyyB =pxxoB + pyyoB → px(xB – xoB) + py(yB – yoB) = 0 px EDxA+ pyEDyA=0 , px EDx B+ pyEDy B=0 px EDx + pyEDy =0WALRAS LAW Walters & Layard CH 2
CONSUMPTION WITHOUT PRODUCTION PURE EXCHANGE WALRAS LAW The sum of price weighted excess demands summed over all markets must be zero. So if one market has positive excess demand , another one should have positive excess supply or negative excess demand . Now , consider an individual market like market for x . Considering the above analysis, at any price level like P0 there will be either excess demand or excess supply in the market. So it is possible to find a range of price level from Po to P1 in such a way that excess demand convert to excess supply . Looking at the following figure , and assuming continuity in the set of price level it is possible to prove (by fixed point theorem ) that there should exist a price level at which excess demand for x will be equal to zero. Walters & Layard CH 2
CONSUMPTION WITHOUT PRODUCTION PURE EXCHANGE B At p1 : excess supply At p0 : excess demand At p* : market is clear p1 P* A po ESx EDx EDx=0 If AB is continuous there should be at least one point of intersection with the vertical line representing the zero excess demand . So, there exist an equilibrium price like P* .(fixed point theorem) .it is worth noting that positive excess demand should increase the price and excess supply (negative excess demand ) should decrease the price. The competitive market do respond like these (same as auctioneer) Walters & Layard CH 2
CONSUMPTION WITHOUT PRODUCTION PURE EXCHANGE At this analysis target variable is EDx and instrumental variable is Px . This is an important conclusion , since the first response to any disequilibrium shock will be the change in price rather than quantity . This is called Walrasian Price adjustment . Stability of equilibrium The equilibrium position is stable by the nature of the control system . Uniqueness of the equilibrium Curve passing through points A and B , will intersect the vertical axis at three points : p1 , p2 ,p3 . Walters & Layard CH 2
CONSUMPTION WITHOUT PRODUCTION PURE EXCHANGE p4 p3 p2 p1 p0 ESx EDx EDx=0 P2 is unstable so it will rule out . Which one of the p3 or p1 is the equilibrium point ? It depends where we start , like all dynamic systems . In the following we will see when there will be more than one equilibrium point ? Walters & Layard CH 2
CONSUMPTION WITHOUT PRODUCTION PURE EXCHANGE In the following figure the locus of all equilibrium points ( offer curve ) for consumer A is drawn . A’soffer curve Relative price of x (px/py) decrease from p1 top2 to p3 .consumption of x increase from x1 to x2 to x3 . Consumption of y decrease from y1to y2but thenincrease to y3 . Why? E yAo u3 u1 c3 u2 y3 y1 c2 C1 y2 x1 x2 x3 xA0 p3 p2 p1 Walters & Layard CH 2
CONSUMPTION WITHOUT PRODUCTION PURE EXCHANGE As it is seen from the figure the consumption of y increase with the decrease in price of x after point c2 . We will show that demand elasticity of x will be elastic before point c2 and inelastic after point c2 . After point c2 if Dx is inelastic ; px↓(=%1) → x↑(<% 1) → pxx (expenditure on x )↓ → if total income does not change → ypy↑ , when py is constant then → y should increase . So when demand for x becomes inelastic after some point , we will have a U shaped offer curve for individual A and a backward-bending supple supply curve for y . As it is shown in the following figure , when offer curves are U shaped , we will have more than one equilibrium point Walters & Layard CH 2
CONSUMPTION WITHOUT PRODUCTION PURE EXCHANGE oB y A’s offer curve E c3 P3 uA c2 uB B’s offer curve c1 p2 p1 x oA Walters & Layard CH 2
CONSUMPTION WITHOUT PRODUCTION PURE EXCHANGE How likely a multiple equilibrium may occur ? For unique and stable equilibrium a rise in px ( or px / py) should bring excess supply of x through reduction in demand for x . When px / py increase ,the change in the demand for x will be as follows ; 1- for both A and B , there will be substitution effect away from x → Dx will fall . 2- individual A is worse off , so the income effect leads him to reduce demand for x ( assuming x is a normal good ) 3- individual B is better off , so his income effect leads him to increase demand for x ( assuming x is a normal good ) We will not be able to predict whether demand for x increase or decrease? It depends on the relative strength of the above effects . If (2) and (3) offset each other , demand for x will decrease unambiguously. For this to happen A and B should have similar marginal propensity to spend on x out of income . Walters & Layard CH 2
CONSUMPTION WITHOUT PRODUCTION PURE EXCHANGE For multiple equilibrium to occur there should be different income effects for individuals A and B and the income effects should be substantial . It s important to know whether multiple equilibrium occur in the real word . If they do , we might be able to improve social welfare by shifting the economy from one equilibrium to another one . We will have positive evidence of multiple equilibrium , if we observe sudden jumps in the economy over time . Coalition and monopoly The above argument does not mean , however that the equilibrium situation which actually comes about will necessarily be a competitive one. It merely says that if , if individuals act as a price taker a competitive equilibrium will result . Walters & Layard CH 2
CONSUMPTION WITHOUT PRODUCTION PURE EXCHANGE But it is generally not in the interest of any one group of individuals to act as a price taker , as steelworkers union leader will always tell you . If all members of group B ( union workers for example )organize themselves collectively How will they settle the equilibrium price ? They will set a price where A’s offer curve was tangential to one of the B’s indifference curve . → point Q . oB A’s offer A’s offer E uA Maximize B’s I.C. S.T. A’s Offer curve R Q B’s offer uB px/py = monopoly price oA Walters & Layard CH 2
CONSUMPTION WITHOUT PRODUCTION PURE EXCHANGE In other words he will maximize uB subject to A’s offer curve . As it is seen , point Q is not on the contract curve , so MRSA > MRS B . As it is seen point Q is not efficient and it may be ethically superior to efficient point R depending upon the needs of people ( helping workers for example) . Clearly if groups of people can gain by forming the coalition ,we should expect to find such collusive behavior on a wide scale . If it does not , this must be because the cost of cooperation between members exceed the benefit they obtain . For the moment we simply note that perfect competition will only be found where the transaction costs of collusion exceed the gains from collusion , or where the law is very strong . Walters & Layard CH 2
Production without consumption Production without consumption ; one sector model . Assumptions ; Many identical firms each owning one unit of labor , L . Many identical capital owners each owning one unit of of output capital , K. Output is produced by may firms with identical production function and constant return to scale to its equilibrium level. This is needed for considering the aggregate production function as constant return one. One good Y with it’s price equal to Py . The amount of Y that a laborer can buy is WL / PY .. the amount of Y that a capital owner can buy is WK / PY . WL and WK are money wage of labor and capital . . Walters & Layard CH 2
Production without consumption With these assumptions we can disregard all features of the production function, except those which describe it in the neighborhood of equilibrium , and so we shall treat each firm as having constant return to scale . Dealing with constant return to scale will lead us to the notion of homogeneous production function Homogeneous production function One of the most important features of the homogenous production function is that RTSLK depends only on the input use ratio , K/L , rather than the absolute level of inputs . If this happens , the output expansion path will be a straight line as while as the price ratio does not change as it is shown in the following figure. Walters & Layard CH 2
Production without consumption Y2 K/L Y1 K Y(mK, mL ) = mαY(K ,L ) m=1/L Y(K ,L )=LαY ( k/L , 1) ∂Y/∂K = L(α-1) Y’( K/L ,1 ) (K/L)’ (PL/ PK )’ PL/ PK L ∂Y/∂L = α L(α-1) Y ( K/L ,1 ) – K/(L2)Lα Y’ (K/L , 1 ) ∂Y/∂L = α L(α-1) Y ( K/L ,1 ) – (K/L)Lα-1 Y’ (K/L ,1) RTSLK= ( ∂Y / ∂L ) / ( ∂Y / ∂K ) = [ αY( K/L,1 ) - ( K/L)Y’( K/L , 1 )] / Y’( K/L ,1 )=h( K/L ) . Walters & Layard CH 2
Production without consumption Taking into account the above argument , for any function like Y=Y(K, L) which is homogeneous of degree one , not even the MRSLK is a function of input use ration but also the marginal product and average product of labor and capital is also a function of input use ration. ∂Y/∂K = Lα-1Y’( K/L ,1 ) , if α=1, YK = Y’( K/L ) ∂Y/∂L = α Lα-1 Y ( K/L ,1 ) – (K/L)L Y’ (K/L ,1) , if α =1 , YL = ∂Y/∂L = Y ( K/L ,1 ) – (K/L)Y’ (K/L) APL= Y(K ,L )/L = [Lα Y ( k/L ,1)]/L, if α=1, APL= Y(k/L,1) APK = Y(K ,L )/K = [Lα Y ( k/L ,1)]/K , if α=1,APK= [1/(K/L)]Y(k/L ,1) In other words when there is constant return to scale , scale does not matter in terms of finding the average and marginal products . With the expansion of output average and marginal product does not change , Walters & Layard CH 2
Production without consumption Taking into account the Euler’s theorem for homogeneous functions ; Y=Y(L,K) (YK)K + (YL)L = αY(L,K), α=degree of homogeneity If α=1 ,constant return to scale, then (YK)K + (YL)L = Y(L,K) P y (YK) K +PY (YL)L =PY Y(L,K) (WK ) K + (WL) L = TR → TC = TR If α > 1 , increasing return to scale ; (YK)K + (YL)L > Y(L,K) P y (YK) K +PY(YL) L >PY Y(L,K) (WK ) K + (WL) L > TR → TC > TR In the increasing return case; if factors of production receive their value of marginal product, loss will occur. But in practical term , natural monopoly will emerge and in that case factors of production will receive MRP=(MR)YL which is less than VMP=PYL . Walters & Layard CH 2
Production without consumption If α < 1 , decreasing return to scale ; (YK)K + (YL)L = αY(L,K), (YK)K + (YL)L < Y(L,K) P y (YK) K +PY(YL) L <PY Y(L,K) (WK ) K + (WL) L < TR → TC < TR if factors of production be paid by their VMP , an entrepreneur excess profit will result . Income distribution Suppose that ; Yi = Y (Ki , Li ) , i=firm , constant return , WL and WK are fixed , for every firm .→ RTSLK = f(Ki /Li ) = WL/WK = fixed → K/L is fixed for every firm Total output of Y=Y(∑iKi , ∑iLi ) = Y(K ,L) . If k/L is fixed for each firm then k/L will be fixed for the aggregate production function since each firm is alike and constant return to scale is present Walters & Layard CH 2
Production without consumption Real wage of capital =MPk =WK/py =∂Y(K,L)/∂K =YK=g(K/L ) Real wage of labor =YL=h(K/L) If L is total supply of labor consist of one unit of labor , then area of obcd equals to capital income . Since capital income equals to capital amount (od) times price of capital (cd) . Since area aodc is total or national income , then area abc equals to labor income Y per k a c Labor income b Yk=g(K/L) Capital income o k/L d= (K/L)1 Walters & Layard CH 2
Production without consumption We can similarly portray the same information with L/K as the dependent variable and provide simple answers for important questions ; Why real wages (YL) , and standard of living (Y/L) is lower in India than Europe . The answer could simply be seen as having higher L/K ( shortage of capital) . Y per L Capital income b b a a How would immigration of workers affect the welfare of capital owner and domestic labor in a country ?As it is seen an amount b will be transferred from domestic workers to capital owners and capital owners would gain a+b and the share of domestic workers reduce to d . Immigrant workers receive an amount equal to c . Labor income d c YL L/K immigrants Resident workers
Production without consumption Suppose that the labor supply increase as was mentioned in the previous example . What will happen to the real factor income ? Marginal product of labor ( YL) will fall and marginal product of capital will rise . And how does relative share change? In order to find the answer we have to see what will happen to the relative factor share , [ (WLL) / (WKK) ]? (WLL) / (WKK) = [YL Py L] / [YKPyK] =(YL/YK)(L/K) When (L/K) increase or (K/L) decrease → ( YL/YK ) decrease . The intensively of the substitution depends on the magnitude of the elasticity of substitution )σ(. σ =(%∆ [K/L] ) / (%∆ [YL/YK] )=(%∆ [K/L] ) / (%∆ [RTSLK] ) If σ>1 , RTSLK ↓=%1→(K/L)↓>%1→(L/K)↑>%1 If (L/K) ↑=%1→ YL/YK = RTSLK↓<%1→ (YL/YK)(L/K) ↑ → (YLL)/(YKK) ↑ What will happen to the total income of labor ? When L/K increase then YK will increase too , and YKK or capital income will increase . If σ>1 then (YLL)/(YKK) increase and (YLL) labor income rise . If σ<1 , and [(YLL)/(YKK)] decrease, and labor income (YLL) may still rise . Walters & Layard CH 2
Production without consumption Two sector model ; Suppose that there are two productive sector ; X , Y . X is more labor intensive than Y , (K/L)x < (K/L)y . What will determine the welfare of the factor owners ? (Wk/px) determines the maximum amount of x an owner of one unit of capital can buy if he spends his whole income on x . (WK/Py) determines the maximum amount of y an owner of one unit of capital can buy if he spends his whole income on y . (Wk/px) and (WK/Py) determines the position of budget line and thus the maximum utility he could get . Walters & Layard CH 2
Production without consumption U(x,y) Y Maximum utility of capital and labor will be a function of factor wages and commodity prices. U K= uK [(WK/PX) , (WK/ PY)] UL = uL [(WL /PX ) , (WL / PY)] WK/PY X WK/PX How are factor and commodity prices determined in a competitive equilibrium ? We need to find out about the preference of the individuals and the demand function for both commodities .this can be done in two steps ; First, we can establish a one to one relationship between the relative price of products( demand for x and y ) and welfare of factor owners.Second, we should confirm that in a closed economy the welfare effect of changes in factor supply is the same as in one sector model Walters & Layard CH 2
Production without consumption The relation between product price and factor price can be illustrated in he following theorem Stopler-Samuelson theorem “ in any particular country a rise in the relative price of labor-intensive good will make labor owner better off and capital owner worse off , and vise versa, provided that some of each good is being produced .” In order to show the above relation we need to establish a one to one relationship between factor prices ( the welfare of factor owners ) and product prices . If Px/Py increase , then production of x will increase (p=MC) , and since x is a labor intensive commodity , demand for labor will increase and cause the wage rate to increase . Increase in wage rate will consequently decrease the amount of labor demanded both for x and y . Walters & Layard CH 2
Production without consumption When Lx and Ly decrease , (K/L)x and (K/L)Y will increase and cause the labor productivity to increase and capital productivity to decrease in the production of both X and Y . So ; (WK/Px =XK) and (WK/PY=YK ) decrease and (WL /Px =XL ) and (WL /PY=YL ) increase and UK= uK [(WK/ Px ) , (WK / PY)] = welfare of capital owners decrease UL =uL [(WL /PX ) , (WL / Py )] welfare of labor owner increase. The same story can be shown in the following figure. This diagram is called “Lerner-Pierce” diagram. Walters & Layard CH 2
Production without consumption Kx , Ky P2 WL/WK (WL/WK)’ P1 R’ S’ P Ky Y=1 unit S Kx R X=1 unit O Lx , Ly Q Ly Q1 Q2 Lx Suppose that there is constant return to scale in production of X and Y . (As it was assumed earlier) cost of producing one unit of x = Px = WK Kx + WL Lx cost of producing one unit of y = Py = WK Ky + WL Ly At the initial factor price of WL/WK → cost of producing one unit of x or y = Px=Py=OP in terms of capital and OQ in terms of labor units . Walters & Layard CH 2
Production without consumption Now suppose that factor price ratio increase to (WL/Wk)’ ; Cost of producing one unit of x =OP2 in terms K and OQ2 in terms of L. Cost of producing one unit of Y =OP1 in terms K and OQ1 in terms of L. According to the diagram increase in the price of x (PP2) is greater than increase in price of y (PP1), since X is labor intensive [ (K/L)x < (K/L)y comparing S to R and S’ to R’] . Comparing S to S’ and R to R’ , we will see that Lx and Ly has both decreased and (K/L)x and (K/L)Y both has increased. As discussed earlier this will cause increase in the productivity of labor in x and Y and welfare of labor owners (UL) to increase and welfare of capital owners (UK) to decrease. This idea can usually be demonstrated by the following diagram . ; Walters & Layard CH 2
Production without consumption X y (WL/WK)0 X is labor intensive so (K/L)x<(K/L)y (K/L)y (K/L)x O (Px/Py)0 As it is shown when Px/Py increase →( WL/WK) increase, and (K/L)x and (K/L)y will increase too . When Px/Py is known , (K/L)x and (K/L)y could be solved in a competitive situation . XK=WK/Px , YK=Wk/Py , XL=WL/Px , YL=WL/Py (YL / XK ) = ( WL / WK ) ( PX / PY ) ( XL / YK ) = ( WL / WK ) ( PY / PX ) ( WL / WK ) , and ( PX / PY ) are known and YL , XK , XL , YK are functions of (K/L)x and (K/L)y . So two equations and two unknowns [(K/L)x and (K/L)y ] could be solved
Production without consumption Now suppose that at a low price of labor Y is indeed capital intensive good , but at a higher values of WL/WK , X becomes capital intensive . In these cases a given product price is consistent with two sets of relative factor prices , input use ratios , and welfare levels of labor and capital owners . Y X (WL/WK)1 (WL/WK)0 (K/L)x1 (K/L)x0 (K/L)y1 (K/L)y0 (Px/Py)0 Walters & Layard CH 2
Production without consumption Kx Ky As it is shown when WL/WK increases Px will increase but still Px/Py =1 . As it is shown , factor intensity reversal occurred . That is ; when factor price ratio changes , input use ratio responds much more in x industry than y . It means that elasticity of substitution is higher in industry x than industry y . This problem matters if we wish to compare countries engaged in international trade . Within a country this may not be a problem . The Lerner- Pearse diagram could show us why this happen (k/L)x1 (K/L)y1 (K/L)y0 (K/L)x0 Y=1 X=1 (WL/WK)1 (WL/WK)0 Lx, Ly Cost of producing one unit of x or y is the same for both of these factor price ratios px /py=1 Walters & Layard CH 2
Production without consumption The relation of output-mix to real factor prices; How the pattern of output is changing as prices changes, and why transformation curve is concave ? OY K0 (WL/WK) <(WL/WK)’ x1 Y1 < (K/L)x1 WL/ WK (K/L)x0 P1 xo Y0 Po Ox L0 (K/L)Yo (K/L)Y1> (K/L)yo Walters & Layard CH 2
Production without consumption Consider a move from P0 to P1 on the contract curve . How does relative factor prices will change ? When factor are fully employed ; (K/L)o = (K/L)x (Lx/Lo) + (K/L)Y (LY/Lo), L0=Lx + Ly Qx( at P1 ) > Qx( at P0 ) Qy ( at P1) < Qy ( at P0) (K/L)x < (K/L)y , at P1 and P0,since x is labor intensive. comparing Lx and Ly at points p0 and p1 ; (Ly / L0) has reduced in P1 , but (Lx/L0 ) has increased in P1 . Higher weight (Lx/L0 ) is being attached to lower K/L {=(K/L)x} The right hand side of the following relation will reduce. To maintain the full employment of factors of production either (K/L)x or (K/L)y or both should increase to maintain the equality . Walters & Layard CH 2
Production without consumption MRSxLK = f(K/L)x =WL/WK MRSY LK = f(K/L)Y =WL/WK factor prices are the same for the production of both goods. So both (K/L)x and (K/L)Y should rise with together, because if one of them increase, the other one will increase too . This will lead to increase in WL/WK .because MRS has increased.this will cause an increase in Px/Py, since x is labor intensive. And also an increase in MCx/MCyin the context of perfect competition which is consistent with increase in the production of X and decrease in the production of Y . This means moving on the production possibility frontier from point A to point B .that is producing more from x and less from y . Y A B X Walters & Layard CH 2
Production without consumption When X is labor intensive PPF is concave to the origin and contract curve is below the diagonal . Contract curves (or production possibility frontier) can not intersect each other . If there is one common point of intersection , all points should be common.( why? ) If the two industries have the same K/L , the contract curve and PPF or transformation curve will be a straight line. But if K/L differs between the two industries , contract curve will be convex or concave towards diagonal (why?). When (Px/Py) permanently increase along with the production of x , then (WL/WK) will increase which will cause (Px/Py) to increase again . Production of x will increase again . This process may continue until all factors of production engaged in the production of x . When this happen . (K/L)x will be fixed , and (WL/WK) will be fixed too. But Px/Py has increased , which is the violation of the Stopler-Samuelson theorem. So in order for the theorem to work , some of each good should be produced . Walters & Layard CH 2
Production without consumption Effect a of changes in factor supply on income distribution in a closed economy suppose that in a closed economy labor supply increase as a result of migration . But the increase is such that factor intensity reversal does not occur.We would like to see what will be the effect of this migration on the income distribution between factors of production . In order to analyze the effect of labor migration on income distribution , in the beginning we will keep the price levels constant (Since (WL/WK) is constant and see what will happen to the demand and supply of factors . Since at the beginning (WL/WK) is fixed , (K/L)x and (K/L)y are constant and does not change , since MRS = MRS(K/L) = (WL/WK) . Walters & Layard CH 2
Production without consumption oy o’y K0 (K/L)x P’ P (K/L)y (K/L)y ox L0 L’ Since (K/L) remains constant production occur along The oxp line . Production point shift from point P to P’ . As a result production of x will increase and y will decrease to maintain full employment . When supply of labor increase with wages remain unchanged , total labor income will increase and cause their demand for x and y to increase too. Walters & Layard CH 2
Production without consumption But production of x increase and for y decrease and cause the relative price of x (px/py) decrease in order to maintain equilibrium . As a result WL/WK will fall based on Stopler-Samuelson theorem . (WL/WK)↓→Lx↑, Ly↑→(K/L)x ↓, (K/L)y ↓→xL ↓,yL↓ →xK↑, yK↑ →→(WL/Px)↓ , (WL/Py)↓ → (WK /Px)↑ , (WK /Py)↑ →→ UL(wL/px , wL/pY) ↓ labor worse off , UK(wK/px , wK/pY) ↑ capital better off . This the same result when we were considering one sector analysis. For further and exact analysis we need to know the elasticity of substitution between industry x and y (when x increase and y decrease ) to find out the degree of relative price decrease . Walters & Layard CH 2
Production and consumption In the final step we have to take into account production and consumption altogether and see if there is an equilibrium set of prices and if they are unique ? Existence of equilibrium could be brought about by using fixed point theorem . We could imagine a very low pxwhich Qx = 0 , and QY = max , and a very high price of x in which Qy=0 , and Qx = max . In the first case excess demand for x is very high and in the second case excess demand for x is equal to zero . So there should be an equilibrium level for px/py in which there is no excess demand for x . For uniqueness of the equilibrium we have to see whether excess demand for x (for both workers and capital owners) decrease with increase in the relative price of x (px/py). Walters & Layard CH 2
Production and consumption ab = excess supply of x bc = excess demand for y Y Y A A1 BL oL Y* equilibrium UK oL UK Y1 E a b A CK UL px/py UL c CL A1 x1 x oK x oK BK X* (px/py)1 Budget constraint Walters & Layard CH 2
Production and consumption As it is shown in the figure , Px has increased and production of x increase and production of y decrease As it was discussed earlier , welfare of labor owners increased and for capital owner decreased as a result of change of the budget line . Equilibrium point convert to a non-equilibrium one . We will expect three effect ; 1- there will be substitution effect away from x and towards consumption of y . Demand for x decrease and for y increase as a result of increase in the price of x . 2- capital owners become worse off , so there will be income effect away from consumption of x ( reduction in the demand for x) . 3- labor owners become better off . So there will be income effect for the increase in the demand for x . If 2 and 3 offset each other , the final effect will be the decrease in the demand for x . So with increase in the price of x , excess supply of x will emerge . So the equilibrium will be unique . Walters & Layard CH 2
PROBLEMS Q2 – 1 . Suppose that consumers of type A are endowed with total supply of X ( X0 ) and consumers of type B are endowed with total supply of Y ( Y0 ) . UA = XA YA and UB = XB YB . In a competitive market what is an equilibrium relative price of X ? Is this equilibrium unique and stable ? Solution ; in the equilibrium total excess demand shoud be equal to zero . MAX UB = XB YB . ( Px / Py ) = P S.T. ( Px / Py ) XB + YB = Y0 , YB = 1/2 Y0 , XB = 1/2 ( Y0 / P ) EDXB = XB = 1/2 ( Y0 / P ) . , YB = 1/2 Y0 , MAX UA = XA YA S.T. P ( XA - X0 ) + YA = 0 , XA = 1/2 X0 , YA = 1/2 X0 P EDXA = XA - X0 = - 1/2 X0 . EDXB + EDXA = 0 , PX / PY = Y0 / X0 = equilibrium price if equilibrium is unique and stable , the excess demand for X decreases with increase in P . EDXA is fixed and EDXB decrease with increase in relative price of X . Walters & Layard CH 2
PROBLEMS Q2-2 Suppose that in the above problem consumers of type A could agree among themselves on a price at which they would sell x ( but consumers of type B could not collude ) . What price would they set ? . YB = 1/2 Y0 of A Initial endowment B X0 P’ B’s offer curve A’s offer curve XA =1/2 X0 (Px / PY)=P= P.C. Price A Initial endowment of B Y0 Solution - Infinitive . B’s offer curve is vertical at ½ Y0 and A needs to offer barely an x in return for y in order to induce B to supply 1/2 Y0 . Therefore anypositive price ( like p’ ) is sufficient to induce this supply . ( the same if type B collude ).
PROBLEMS Q2-3 – if Y = 100 K1/2 L1/2 , where Y is output per head , K is capital stock and L is man-year . What is the real wage and output per worker in the following countries . Solution : Walters & Layard CH 2
Q2-4 , If Y = K1/4 L3/4 and the labor force is constant at L0 , how does increase in capital accumulation ( from K0 to K1 ) affect i- the real wage and real capital rental ii- The relative shares of national income iii- the absolute share of capital Solution ; i- we know that increase in ( K/L) increase the real wage ( YL ) of labor and decrease the real capital rental ( YK ) . ii- Relative real share of factor income are equal to ( YL L) / (YK K) . ( YL L) = (3/4 y L-1 ) ( L ) , (YK K) = ( 1/4 Y K-1 ) K ( YL L) / (YK K) = 3 , this holds independently of K/L . ( YL L) + (YK K) = Y0 = national income Relative share of labor = ( YL L) / Y0 [Y0 / ( YL L) ] = 1 + (YK K)/( YL L) = 1 + 1/3 = 4/3 ( YL L)/ Y0 = 3/4 , Relative share of capital =(YK K)/ Y0 = 1/4 iii- absolute share of capital = (YK K) = 1/4 Y0 absolute share of labor = ( YL L) = 3/4 Y0