Optical Electronic Spectroscopy 1
Optical Electronic Spectroscopy 1. Lecture Date: January 23 rd , 2008. The Electromagnetic Spectrum. UV-Visible X-ray. What is Electronic Spectroscopy?. Spectroscopy of the electrons surrounding an atom or a molecule: electron energy-level transitions.

Optical Electronic Spectroscopy 1
E N D
Presentation Transcript
Optical Electronic Spectroscopy 1 Lecture Date: January 23rd, 2008
The Electromagnetic Spectrum • UV-Visible • X-ray
What is Electronic Spectroscopy? • Spectroscopy of the electrons surrounding an atom or a molecule: electron energy-level transitions Atoms: electrons are in hydrogen-like orbitals (s, p, d, f) Molecules: electrons are in molecular orbitals (HOMO, LUMO, …) From http://education.jlab.org (The LUMO of benzene) (The Bohr model for nitrogen)
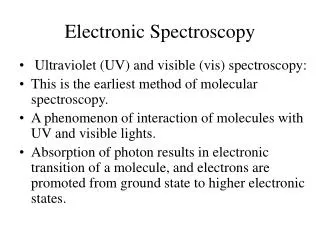
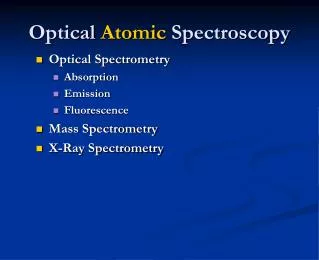
Optical Electronic Spectroscopy • Definition: Spectroscopy in the optical (UV-Visible) range involving electronic energy levels excited by electromagnetic radiation (often valence electrons). • This lecture is related to the “high-energy” (“non-optical”) electron spectroscopy covered in the X-ray lecture • Methods: • Atomic absorption • Atomic emission (e.g ICP-OES) • Molecular UV-Visible absorption • Luminescence, Fluorescence, Phosphorescence
Definitions of Electronic Processes • Emission: radiation produced by excited molecules, ions, or atoms as they relax to lower energy levels. • Absorption: radiation selectively absorbed by molecules, ions, or atoms, accompanied by their excitation (or promotion) to a more energetic state. • Luminescence: radiation produced by a chemical reaction or internal electronic process, possibly following absorption.
More Electronic Processes • Fluorescence: absorption of radiation to an excited state, followed by emission of radiation to a lower state of the same multiplicity • Occurs about 10-5 to 10-8 seconds after photon absorption • Phosphorescence: absorption of radiation to an excited state, followed by emission of radiation to a lower state of different multiplicity • Occurs about 10 to 10-5 seconds after photon absorption
What is Emission? • Atoms/molecules are driven to excited states (in this case electronic states), which can relax by emission of radiation. M + heat M* Higher energy E = hn Lower energy • Other process can be active, such as “non-radiative” relaxation (e.g. transfer of energy by random collisions). M* M + heat • OES = Optical Emission Spectroscopy
What is Absorption? • Electromagnetic radiation travels fastest in a vacuum. • When EM radiation travels through a substance, it can be slowed by propagation “interactions” that do not cause frequency (energy) changes: • Absorption does involve frequency/energy changes, since the energy of EM radiation is transferred to a substance, usually at specific frequencies corresponding to natural atomic or molecular energies • Absorption occurring at optical frequencies involves low to mid-energy electronic transitions. c = the speed of light (~3.00 x 10⁸ m/s) i = the velocity of the radiation in the medium in m/s ni = the refractive index at the frequency i
P0 P Absorption and Transmission • Transmittance: T = P/P0 • Absorbance: A = -log10 T = log10 P0/P b A is linear vs. b! (A preferred over T) Graphs from http://teaching.shu.ac.uk/hwb/chemistry/tutorials/molspec/beers1.htm
The Beer-Lambert Law • The Beer-Lambert Law (a.k.a. Beer’s Law): A =ebc Where the absorbance A has no units, since A = log10 P0 / P e is the molar absorbtivity with units of L mol-1 cm-1 b is the path length of the sample in cm c is the concentration of the compound in solution, expressed in mol L-1 (or M, molarity) • Beer’s law can be derived from a model that considers infinitesimal portions of a “block” absorbing photons in their cross-sections, and integration over the entire block • Beer’s law is derived under the assumption that the fraction of the light absorbed by each thin cross-section of solution is the same • See pp. 302-303 of Skoog, et al. for details
Deviations From the Beer-Lambert Law • Deviations from Beer’s law (i.e. deviations from the linearity of absorbance vs. concentration): • Intermolecular interactions at higher concentrations • Chemical reactions (species having different spectra) • Peak width/polychromatic radiation • Beer’s law is only strictly valid with single-frequency radiation • Not significant if the bandwidth of the monochromator is less than 1/10 of the half-width of the absorption peak at half-height. For an alternative view, see: Bare, William D. A More Pedagogically Sound Treatment of Beer's Law: A Derivation Based on a Corpuscular-Probability Model, J. Chem. Educ.2000,77, 929.
Deviations from the Beer-Lambert Law • Intermolecular interactions at higher concentrations: Dimers, oligomers Figure from Chapter 5 of Cazes, Analytical Instrumentation Handbook 3rd Ed. Marcel-Dekker 2005.
Deviations from the Beer-Lambert Law • Deviations caused by use of polychromatic light on a spectrum in which e changes a lot over the bandwidth of the light. • Consider two wavelengths a and b with a and b = 1000, 1000 = 1500, 500 = 1750, 250 Absorbance (A) Concentration (M)
Basic Instrument Layout for Optical Spectroscopy • Absorption: Radiation Source Sample Wavelength Selector Detector (photoelectric transducer) • Fluorescence, Phosphorescence and Scattering: Sample Wavelength Selector Detector (photoelectric transducer) Radiation source (90° angle) • Emission and chemi-luminescence Sample (source) Wavelength Selector Detector (photoelectric transducer)
Atomization: The Dividing Line for Atomic/Molecular • Samples used in optical atomic (elemental) spectroscopy are usually atomized • This destroys molecules (if present) and leaves the atoms • The UV-visible spectrum of the atoms is of interest, not the molecular spectrum.
Elemental Analysis • Elemental analysis – qualitative or quantitative determination of the elemental composition of a sample • Optical electronic methods are heavily used in elemental analysis • Other elemental analysis methods not discussed here: • Mass spectrometry (MS), e.g. ICP-MS • X-ray methods • Other methods (radiochemical) • Classical
Atomic Electronic Energy Levels • Electronic energy level transitions in hydrogen – the simplest of all! • Balmer series (visible) • Transitions start (absorption) or end (emission) with the first excited state of hydrogen • Lyman series (UV) • Transitions start (absorption) or end (emission) with the ground state of hydrogen Diagrams from http://csep10.phys.utk.edu/astr162/lect/light/absorption.html
Atomic Electronic Energy Levels • Term symbols and electronic states: used to precisely define the state of electrons spin multiplicity s = total spin quantum number j = total angular momentum quantum number l = orbital quantum number (s,p,d,f…) mj= state Term: 2P s,p,d,f,g (l value) Level: 2P3/2 2j+1 State: 2P3/2-1/2 • Used to denote energy levels, and label term (Grotrian) diagrams for the hydrogen atom Figure from the Sapphire Electronic Spectroscopy Software Package, Cavendish Instruments Limited.
Atomic Electronic Energy Levels • Term symbol (Grotrian) diagram for the sodium atom • Each transition on the diagram can be linked to a peak in the spectrum • The number of lines can approach 5000 for transition-metal elements. • Line broadening can be caused by: • Doppler effects • pressure broadening (collisions) • Lifetime of state (uncertainty) Figure from H. A. Strobel and W. R Heineman, Chemical Instrumentation: A Systematic Approach, Wiley, 1989.
Atomic Electronic Energy Levels • The population of energy levels partly determines the intensity of an emission peak • The Boltzmann distribution relates the energy difference between the levels, temperature, and population: E = energy of state P = number of states having equal energy at each level N = number of atoms in state • Key point: to get more atoms into excited states, you need higher temperatures. (See example 8-2, problem 8-9) (Values from Cazes pg 79, Table 1)
Atomic Electronic Energy Levels The simulated spectrum for the sodium atom
Atomic Emission • Two types of emission spectra: • Continuum • Line spectra • Examples: • ICP-OES (inductively-coupled plasma optical emission spectroscopy), also known as ICP-AES • LIBS (laser-induced breakdown spectroscopy)
Torches and Atomic Emission • History: Emission came first (study of sunlight by Fraunhofer in 1817, identification of spectral “lines”), studied throughout the 1800’s and early 1900’s • Before the use of the plasma for OES in 1964, the flame/gas torch (or arc/spark, etc…) had the following problems: • Temperature instability • Not hot enough to excite/decompose all materials • Today: The plasma has become the almost universally-preferred method • History: atomic emission placed demands on monochromators • Today: Technology has led to polychromators/detectors with sufficient resolution
Plasma Torches • Plasma: a low-density gas containing ions and electrons, controlled by EM forces
Plasma Torches • In the inductively-coupled plasma (ICP) torch, the sample will reside for several milliseconds at 4000-8000K. • Other torches – direct current plasma • Microwave induced plasma • An argon ICP torch in action: Photo by Steve Kvech, http://www.cee.vt.edu/program_areas/environmental/teach/smprimer/icpms/icpms.htm#Argon%20Plasma/Sample%20Ionization
More on Plasma Torches • Another view of an argon ICP torch: Diagram from Lagalante, Appl. Spect. Reviews. 34, 191 (1999)
Arc and Spark Sources for Atomic Emission • Arc and spark sources – used for qualitative analysis of organic and geological samples • Only semi-quantitative because of source instability • Spark sources achieve higher energies • Several mg of solid sample is packed between electrodes, 1-30 A of current is passed achieving several hundred volts potential. • Applications include metals analysis or cases where solids must be analyzed.
Atomic Emission: Mono- and Polychromators • Diffraction gratings are used to select wavelengths (in combination with collimating lens, and slits) • Echelle (ladder) gratings: high dispersion and high resolution • ~1000-1500 grooves/mm typical for UV-Vis work • Require filters to isolate “orders” (i.e. n=1) m = d(sin i + sin r)
Atomic Emission: Detectors • At the end of the spectrometer, photons are detected. • Commonly used detectors: • Photomultiplier tubes (PMT) – dynamic range 109 • Solid-state detectors: • Charge-coupled devices (CCD) – 1D or 2D arrays (charge readout or “transfer” devices) • Silicon photodiodes with thousands of individual elements • Very sensitive, very well-suited to echelle grating polychromators, very fast
Modern ICP-OES Spectrometers • Example system: Varian Vista PRO • Features: 1. Axial flame view 2. Echelle grating polychromator 3. CCD detector • CCD chips are often made of sub-arrays matched to emission lines. Figure from Varian Vista PRO sales literature.
Detection Limits of ICP-OES • Typical detection limits (Varian Vista MPX): • Considerations include the number of emission lines, spectral overlap • Linearity can span several orders of magnitude. • See also Figure 10-13 in Skoog, et al.
Atomic Absorption – Early History • In the beginning – atomic emission was the only way to do elemental analysis via optical spectroscopy • Bunsen and Kirchhoff (1861) – invented a non-luminous flame to study emission. Showed that alkali elements in the flame removed lines from a continuous source. • Walsh (1955) – notices that molecular spectra are often obtained in absorption (e.g. UV-Vis and IR), but atomic spectra are always obtained in emission. Proposes to use atomic absorption (AA or AAS) for elemental analysis • Advantages over emission – far less interference, avoids problems with flame temperature
Atomic Absorption (AA) and Elemental Analysis • Atomic absorption spectrometry is one of the most widely used methods for elemental analysis. • Basic principles of AA: • The sample is atomized via: • A flame (methane/H2/acetylene and air/oxygen) • An electrothermal atomizer (an electrically-heated graphite tube or cup) • UV-Visible light is projected through the flame • The atoms absorb light (electronic excitation), reducing the beam • The difference in intensity is measured by the spectrometer Source P0 Sample/Flame P Monochromator Detector Images are of Aurora AI1200, http://www.spectronic.co.uk
Atomic Absorption: Sources • Hollow cathode lamps – sputtering of an element of interest, generating a line emission spectrum: • Typical linewidths of 0.002 nm (0.02Å) • Other AA Sources: electrode-less discharge lamp (EDL) – see Skoog Ch 9B-1
Atomic Absorption: Monochromators • The monochromator filters out undesired light in AA (typical bandwidths are 1 angstrom/0.1 nm) • Unlike ICP-OES, where the mono- or polychromator actually analyzes the frequency. • In other words – there is no need to scan the grating, just set (aimed through a slit) and run • Echelle (ladder) gratings are popular: Figure from T. Wang, in J. Cazes, ed, “Ewing’s Analytical Instrumentation Handbook”
Other Features of Atomic Absorption Systems • Sample nebulizers: Produces aerosols of samples to introduce into the flame (oxyacetylene is the hottest) • Detectors: Common examples are photomultiplier tubes, CCD (charge-coupled devices), and many more. • Monochromator: removes emissions from the flame (flame is often kept cool just to avoid emission) • Modulated source (chopper): also removes the remaining emissions from the flame. The signal of interest is given an AC modulation and passed through a high-pass filter. • Spectral interferences: • Absorption from other things (besides the element of interest) – other flame components, particulates, etc… Scattering can cause similar problems • Background correction can help
How Are Elements Actually Analyzed? • For AA and ICP-OES, samples are dissolved or digested into solution. • Samples are flowed into the flame/plasma and analyzed. • Two methods for quantitative analysis: • Standard calibration: the unknown sample’s absorbance/emission is compared with several references which “bracket” the expected concentration. (Linear relationship) • Standard addition: the unknown sample is divided into several portions. One portion is directly analyzed, the others have the reference material added in varying amounts. The linear relationship is determined, and the intercept is used to calculate the real concentration of the unknown • At the end: the results yield elements in ppm, ppb, mg/mL, etc…
Atomic Fluorescence • Developed as an alternative to AA and ICP-OES, with potentially greater sensitivity. • Has not yet achieved widespread use but cheaper tunable lasers may change this. • Laser – stimulated emission (coherent emission from an excited state induced by a second photon) • Processes: Non-radiative hv Thermal hv Non-radiative hv hv Direct Line Stepwise Thermally-assisted Resonance
Atomic Fluorescence • Instrumentation Sample Wavelength Selector Detector (photoelectric transducer) Radiation source (90° angle) • Sources include hollow-cathode lamps, electrodeless discharge tubes (brighter), and lasers (brightest) Picture from Perkin-Elmer
Laser-Induced Breakdown Spectroscopy (LIBS) • Just like ICP-OES, except a focussed laser creates the plasma: Fiber optic Figure from US Army/Ames
Elemental Analysis with Optical Spectroscopy • A comparison of the techniques – the choice is not always clear! • Speciated analysis: The analysis of atomic “species”, elements in chemically distinguishable environments. • Examples of hyphenation to add “speciation”: • ICP-OES coupled to a HPLC • AA coupled to a GC
Homework ProblemsOptical Electronic Spectroscopy Chapter 8: Problem 8-9 Chapter 10: Problem 10-2
Further Reading Review Skoog et al. Chapters 6-10 Review Cazes Chapters 3-4 Optical Electronic Spectroscopy H. A. Strobel and W. R. Heineman, “Chemical Instrumentation: A Systematic Approach”, 3rd Ed., Wiley (1989).