Download
1 / 65
660 likes | 828 Vues
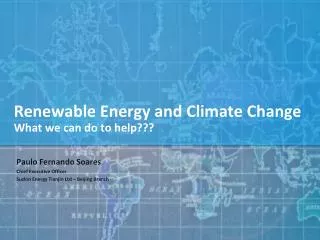
Renewable Energy and Climate Change What we can do to help???. Paulo Fernando Soares Chief Executive Officer Suzlon Energy Tianjin Ltd – Beijing Branch. Biography. Paulo Fernando Soares has joined Suzlon Energy Ltd in Jul 2005.

E N D
Renewable Energy and Climate ChangeWhat we can do to help??? Paulo Fernando Soares Chief Executive Officer Suzlon Energy Tianjin Ltd – Beijing Branch
Biography Paulo Fernando Soares has joined Suzlon Energy Ltd in Jul 2005. Previously to Suzlon, Paulo has worked fro 15 years in the Hydro Power business, in Brazil and China, where he has acquired experience in the areas of Manufacturing, Project Management, Engineering, Cost estimate, Project Cost Control and others. He was an employee from Siemens Hydro in Brazil from 1988 to 2000 and from Voith Siemens Hydro in China from 2000 to 2005. Paulo has 5 years experience in the Hydro-Power Business industry in China, dealing with all the five power group companies, and was responsible for the execution of major projects. At Suzlon, Paulo has taken the responsibility to establish the Beijing Office and, together with his team, has successfully negotiated 325 MW in Suzlon contracts in China In The last 24 months Suzlon has grown into a major player in China, with about 850 employees and a factory with capacity to manufacture 600 MW/year, established in Tianjin. Paulo has a bachelor degree in Mechanical Engineering at Faculdade de Engenharia Industrial – FEI and a Executive MBA in General Management at Fundação Dom Cabral – FDC, both in Brazil. • Brazilian • Indian Company • China • Engineer • Hydro Power • Wind Power • Manufacturing, • Engineering • Project Management • Contract Administration • Sales and Marketing
The Greenhouse Effect • The greenhouse effect is the process by which the atmosphere traps some of the sun’s energy, warming the earth and moderating our climate. A human-driven increase in greenhouse gases’ is increasing this effect artificially, raising global temperatures and disrupting our climate. • These greenhouse gases include carbon dioxide, produced by burning fossil fuels and through deforestation, methane, released from agriculture, animals and landfill sites, and nitrous oxide, resulting from agricultural production plus a variety of industrial chemicals. Source: Greenpeace / EREC – Energy [R]evolution l Jan 2007
OECD Organization for Economic Development and Cooperation
16 Core Global Risks Likelihood with Severity by Number of Deaths Carbon emissions are growing above trend and there are indications that feedback mechanisms, particularly increased heat-absorption caused by Arctic ice-melt, will increase the speed and scale of warming. New research argues that the increasing intensity of North Atlantic hurricanes is due to global warming. Note: For seven of the core global risks, severity by number of deaths was not applicable. Likelihood was based on actuarial principles where possible. For most risks, however, qualitative assessment was used. Source: Global Risks 2007 World Economic Forum Report 2007
Climate Change – Electricity Demand per region • The OECD regions (shown in red), led by North America, had the highest demand per capita in 2005. In total, they accounted for about 60% of global electricity use despite having less than 20% of the world’s population. • In contrast, the non-OECD regions have much lower levels of per-capita electricity use today but their populations are huge. These markets will grow significantly – both in population size and electricity use. • By 2030, even though per-capita non-OECD consumption will still be well below OECD levels, the increases will be dramatic. Non-OECD electricity use will be about 70% higher on a per-capita basis, with total demand more than doubling. • Electricity consumption on a per-capita basis is generally very different in OECD versus non-OECD countries. • While this distinction is important on its own, its significance can be further highlighted by contrasting the level of electricity use per capita relative to population levels across OECD and non-OECD regions. Source: Exxon Mobil l The Outlook for Energy - A View to 2030
Renewable Energy Global Consumption • Renewable energy supplies 18 percent of the world’s final energy consumption, counting traditional biomass, large hydropower, and “new” renewables (small hydro, modern biomass, wind, solar, geothermal, and biofuels – see Fig 1) • Traditional biomass, primarily for cooking and heating, represents about 13 percent and is growing slowly or even declining in some regions as biomass is used more efficiently or replaced by more modern energy forms. • Large hydropower represents 3 percent and is growing modestly, primarily in developing countries. New renewables represent 2.4 percent and are growing very rapidly in developed countries and in some developing countries Source: REN21 – Global Status Report 2007
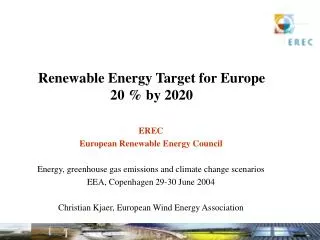
Renewable Energy Targets • Policy targets for renewable energy exist in at least 66 countries worldwide. By 2007, at least 64 countries had a national target for renewable energy supply, including all 27 European Union countries • In early 2007, the European Commission adopted new binding targets for 2020, including 20 percent of final energy and 10 percent of transport fuels. The 20 percent final energy target could imply 34 percent of electricity provided by renewables by 2020, according to the European Commission. • Similar to the existing electricity targets, individual countries will need to agree on and adopt their own targets to meet the 20 percent EU-wide target; • The 64 countries with national targets include 22 developing countries: Algeria, Argentina, Brazil, China, the Dominican Republic, Egypt, India, Indonesia, Iran, Jordan, Malaysia, Mali, Morocco, Nigeria, Pakistan, the Philippines, Senegal, South Africa, Syria, Thailand, Tunisia, and Uganda. Source: REN21 – Global Status Report 2007
Renewable Energy Global Resources • Nature offers a variety of freely available options for producing energy. It is mainly a question of how to convert sunlight, wind, biomass or water into electricity, heat or power as efficiently, sustainably and cost effectively as possible. • On average, the energy in the sunshine that reaches the earth is about one kilowatt per square meter worldwide. According to the Research Association for Solar Power, power is gushing from renewable energy sources at a rate of 2,850 times more energy than is needed in the world today. In one day, the sunlight which reaches the earth produces enough energy to satisfy the world’s current power requirements for eight years. Even though only a percentage of that potential is technically accessible, this is still enough to provide just under six times more power than the world currently requires. Source: Greenpeace / EREC – Energy [R]evolution l Jan 2007
Climate Change – Energy Demand • While population and economic growth are fundamental drivers of overall energy demand, the types of energy used to meet specific needs are influenced by a variety of additional factors. These include economics, supply availability, income levels and public policies. • In 2005, global primary energy consumption was approximately 230 MBDOE, comprised of fossil fuels – oil, natural gas and coal – plus other non-fossil energy, namely nuclear power and renewable sources. • By 2030, energy demand is expected to reach almost 325 MBDOE, or approximately 40 percent more than in 2005. • Overall global demand and the need for particular energy types are also influenced considerably by the growing and diverse requirements of the major demand sectors – power generation, transportation, industrial and residential/commercial. • Each of the major demand sectors will experience considerable growth through 2030. The largest sector today – and the one with greatest anticipated volume growth going forward – is power generation. The fastest-growing sector – and the one most important to oil demand – is transportation. These two sectors will have a dramatic impact on energy trends through 2030. Source: Exxon Mobil l The Outlook for Energy - A View to 2030
Climate Change – Energy Demand In China • Over 75 percent of the demand growth in recent years has come from the power sector, as electricity demand boomed and alternative fuel sources for generating that electricity (hydro, natural gas, wind and nuclear) failed to keep pace (figure 22). • Of the 50 percent of coal not consumed by the power sector, the majority is sold directly to industry for use in boilers, coking ovens and on-site (“inside the fence”) power generation. • Household coal consumption; which accounted for 20 percent of total demand in 1985, has dropped to 4 percent as China’s residents move into homes equipped with gas and electricity for cooking and heating. • The lion’s share of the country’s electricity is consumed by industry, with 10 percent going to iron and steel production alone Driven by the electrification of both household and enterprise energy use, the Chinese economy has created as much new demand for power since 2000 as the total demand for power in France, Germany and the UK combined. In 2006 and 2007 alone China added over 200 GW of new capacity, equivalent to the double entire installed base of Africa. Source: China Energy – A guide for the perplexed / Daniel Rosen and Trevor Houser May 2007
Climate Change – Oil Reserves and Consumption • World Oil Consumption rose just under 650,000b/d, about half of the 10-year average. OECD Consumption fell by 400,000 b/d, the biggest decline since 1983 • Oil consumption growth was above average in China and oil-exporting Countries Source: BP Statistical Review of World Energy 2007
Climate Change – Coal Reserves and Consumption • Coal was again the world’s fastest growing fossil fuel in 2006. Global consumption rose by 4.5% compared wit a 10 year average of 2.8%. • The Asia Pacific region accounted for nearly 90% of the global growth in consumption and 80% of growth in production. Source: BP Statistical Review of World Energy 2007
Wind Power Resources – China and USA Wind distribution map of China, shows that the north of the country and costal areas are the most favorable for wind farms. Regions in Tibet with high winds have extremely difficult access and are not yet developed. In the USA, the main wind resources are in the Midwest, in the area of the grand lakes and in the Rockies
The Wind Turbines – development cycle • Since early recorded history, people have been harnessing the energy of the wind. Wind energy propelled boats along the Nile River as early as 5000 B.C. By 200 B.C., simple windmills in China were pumping water, while vertical-axis windmills with woven reed sails were grinding grain in Persia and the Middle East • By the 11th century, people in the Middle East were using windmills extensively for food production; returning merchants and crusaders carried this idea back to Europe. • The Dutch refined the windmill and adapted it for draining lakes and marshes in the Rhine River Delta. • When settlers took this technology to the New World in the late 19th century, they began using windmills to pump water for farms and ranches
The Wind Turbines – How it works? • The wind blows on the blades [1] and makes them turn. • The blades turns a shaft [5] inside the nacelle [11] (the box at the top of the turbine) • The shaft goes into a gearbox [6] which increases the rotation speed enough for... • The generator [7], which uses magnetic fields to convert the rotational energy into electrical energy. These are similar to those found in normal power stations. • The power output goes to a transformer, which converts the electricity coming out of the generator at around 700 Volts (V) to the right voltage for distribution system, typically 33,000 V.
Windpower Global Installations • In the USA, every 1MW of wind power installed can generate electricity for about 300 households; • In China, due to the fact that the consumption per capita is much lower than in the USA, every 1 MW of windpower installed can generate power for about 1,800 households
Power Capacity DevelopmentActual 2007 x Target in 2010 Analysis Installed capacity growth Actual x Target Despite the fact that the government has set ambitious targets for 2010 and 2020, it is important to define whether Large Hydro is part of the target: % RE 0.64% 0.76% 1.08% 1.17% 4.14% 6.00% 6.06% 1,493.7 1.493.7 Incl. Nuclear – 2007: 8.8GW 2006: 5.3GW 976.5 917.0 Electricity generation profile in 2007: 713.0 622.0 517.2 The targets for RE (excluding Large Hydro) must be reviewed to more realistic numbers considering the current development of the industry. Source: National Development & Reform Commission; "Renewable Energy Sources Medium to Long Term Development Plan" report published August 2007, released 4 September 2007. National capacity = Merrill Lynch AsiaPac Utilities Research Estimates
Power Capacity Development in ChinaRenewable Energy Sources Analysis Installed capacity growth Actual x Target • If we analyze the breakdown of the different Renewable Energy sources and its development forecast, we will clearly see that Large Hydro will be the main player, attracting the bulk of the investments. • The breakdown figures (in GW) for hydro is as follows: % H 97.3% 96.5% 94.6% 82.9% 75.7% 76.7% 390.9 361.9 241.6 200.8 132.7 120.3 • Renewable energy sources not derived from Large Hydro schemes should have development priority in order to avoid the repetition of the 2007 situation, when droughts in the south pushed the consumption of eletricity generated by coal fired thermo power plants Source: National Development & Reform Commission; "Renewable Energy Sources Medium to Long Term Development Plan" report published August 2007, released 4 September 2007. National capacity = Merrill Lynch AsiaPac Utilities Research Estimates
Windpower Facts Advantages • Wind energy is fueled by the wind, so it's a clean fuel source. Wind energy doesn't pollute the air like power plants that rely on combustion of fossil fuels, such as coal or natural gas. Wind turbines don't produce atmospheric emissions that cause acid rain or greenhouse gasses. • Wind energy is a domestic source of energy; • Wind energy relies on the renewable power of the wind, which can't be used up. Wind is actually a form of solar energy; winds are caused by the heating of the atmosphere by the sun, the rotation of the earth, and the earth's surface irregularities. • Wind energy is one of the lowest-priced renewable energy technologies available today, costing between 4 and 6 cents per kilowatt-hour, depending upon the wind resource and project financing of the particular project. • Wind turbines can be built on farms or ranches, thus benefiting the economy in rural areas, where most of the best wind sites are found. Farmers and ranchers can continue to work the land because the wind turbines use only a fraction of the land. Wind power plant owners make rent payments to the farmer or rancher for the use of the land.
Windpower Facts Disadvantages • Disadvantages • Wind power must compete with conventional generation sources on a cost basis. Depending on how energetic a wind site is, the wind farm may or may not be cost competitive. Even though the cost of wind power has decreased dramatically in the past 10 years, the technology requires a higher initial investment than fossil-fueled generators. • The major challenge to using wind as a source of power is that the wind is intermittent and it does not always blow when electricity is needed. Wind energy cannot be stored (unless batteries are used); and not all winds can be harnessed to meet the timing of electricity demands. • Good wind sites are often located in remote locations, far from cities where the electricity is needed. • Although wind power plants have relatively little impact on the environment compared to other conventional power plants, there is some concern over the noise produced by the rotor blades, aesthetic (visual) impacts, and sometimes birds have been killed by flying into the rotors. Most of these problems have been resolved or greatly reduced through technological development or by properly sitting wind plants.
Hydropower Facts • The flow of water has been used for thousands of years to provide mechanical energy to grind grain, drive sawmills, and pump water . • Hydropower is a renewable source of energy. Water continuously moves through a global cycle, evaporating from lakes and oceans, forming clouds, precipitating as rain or snow, and flowing back to the oceans. This water cycle is produced by the sun and driven by gravity. • Hydropower facilities can capture the energy in flowing water by damming a river (impoundment), or channeling a portion of a river through a generating facility (diversion).
Hydropower Facts • Is abundant: Hydroelectricity makes up around 10 percent of the nation’s electric supply and about 20 percent worldwide, and furnishing an estimated 80 percent of renewable electricity in the U.S. • Is renewable: It makes use of the hydrological cycle that consists of a never-ending, timeless cycle of evaporation and precipitation. • Is clean: It produces zero emissions in the generation of electricity and, in its use, we avoid burning additional carbon-based fossil fuels. • Is reliable: It is a fast, flexible and firm generation source that helps maintain the reliability of the electric grid.
Hydropower Facts • Is inexpensive: In the U.S., hydropower is produced for an average of $7 per megawatt-hour (MWh) or about one-third the cost of using fossil or nuclear fuels and less than one-sixth the cost of using natural gas. • Provides recreational opportunities: The 2000-plus federally licensed hydropower projects provided two and a half times as many recreation days as all the U.S. national forest trails put together and eight times as many recreation days as Yosemite and Yellowstone Park combined. Projects provide a variety of water-based recreation, including fishing, water sports, boating, water fowl hunting, and whitewater sports. • Provides multipurpose projects. Other multipurpose uses for hydropower reservoirs include flood control, inland navigation, and industrial, municipal, and agricultural water supply.
The Hydro Power Plant in the past • The first U.S. hydroelectric power plant opened on the Fox River near Appleton, Wisconsin, on September 30, 1882. • Just having water in the river isn't enough. A good hydropower site must have enough stream-flow as well as enough head. For example, the Mississippi River has tremendous stream-flow, but only a few of its dams are high enough to provide the head needed for efficient hydropower development. Dams in the arid West may have plenty of head, but not enough stream-flow.
Hydropower Facts • Worldwide, hydropower plants produce about 24 percent of the world's electricity and supply more than 1 billion people with power. • The world's hydropower plants output a combined total of 675,000 megawatts, the energy equivalent of 3.6 billion barrels of oil, according to the National Renewable Energy Laboratory. • There are more than 2,000 hydropower plants operating in the United States, making hydropower the country's largest renewable energy source.
Purpose of Dams and World capacity Source: http://www.fema.gov/hazard/damfailure/benefits.shtm
Hydropower Facts Advantages and Disadvantages • Advantages • A hydro-electric power scheme uses a renewable source of energy and therefore does not consume limited fossil fuels or pollute the atmosphere with combustion gases. • Unlike conventional coal-fired power stations, which take hours to start up, hydro-electric power stations can begin generating electricity very speedily. So hydro-electric plants are particularly useful for responding to sudden increases in the demand for electricity by customers. • These stations need only a small staff to operate and maintain them and are not subject to fluctuations in fuel prices. • Disadvantages • Hydro-electric generation often requires the construction of dams, which may result in serious environmental damage. It may involve the serious inundation of large areas of land and the loss of wildlife habitat; an impact on fish breeding; changes in water flow and the river eco-system; changes in sediment and salt contents; and so on. • Water storage schemes are very costly to build.
Different Hydro Power Plants • Storage projects impound water behind a dam, forming a reservoir. • Water is released through turbine-generators to produce electricity. The water storage and release cycles can be relatively short, for instance, storing water at night for daytime power generation. Or, the cycles can be long, storing spring runoff for generation in the summer when air conditioner use increases power demand. • Some projects operate on multi-year cycles carrying over water in a wet year to offset the effects of dry years. Yellowtail Dam Bighorn River - MO
Different Hydro Power Plants – Pumped Storage • Pumped-storage" projects use off-peak electricity to pump water from a lower reservoir to an upper reservoir. During periods of high electrical demand, the water is released back to the lower reservoir to generate electricity.
Different Hydro Power Plants – Storage Projects • Storage projects impound water behind a dam, forming a reservoir. Water is released through turbine-generators to produce electricity. • The water storage and release cycles can be relatively short, for instance, storing water at night for daytime power generation. Or, the cycles can be long, storing spring runoff for generation in the summer when air conditioner use increases power demand. Some projects operate on multi-year cycles carrying over water in a wet year to offset the effects of dry years. Yellowtail Dam Bighorn River - MO
Different Hydro Power Plants – Run of the River • "Run-of-river" projects typically use relatively low dams where the amount of water running through the powerhouse is determined by the water flowing in the river. Because these plants generally do not hold back water behind storage dams, they tend to affect upstream water levels and downstream stream flow less than storage projects. Electricity generation from these plants will vary with changes in the amount of water flowing in the river.