Download

1 / 16
160 likes | 278 Vues
Hyporheic Exchange and Urban Water Demand Studies. Hyporheic Exchange over Dunes and Ripples. High. Turbulent Stream Flow. Pressure. Low. Sediment ( Hyporheic Zone). Hyporheic Exchange over Dunes and Ripples. High. Turbulent Stream Flow. Pressure. Low. Downwelling. Upwelling.

E N D
Hyporheic Exchange over Dunes and Ripples High Turbulent Stream Flow Pressure Low Sediment (Hyporheic Zone)
Hyporheic Exchange over Dunes and Ripples High Turbulent Stream Flow Pressure Low Downwelling Upwelling Sediment (Hyporheic Zone)
Microbial Metabolism High Turbulent Stream Flow Total N DOC Pressure O2 Low Strong redox gradients Strong nutrient gradients Aerobic respiration: Nitrification: Denitrification:
“River’s Liver” High Turbulent Stream Flow Heat Cu CEC P Cd Zn H+ Pb Bacteria Viruses Total N DOC Pressure O2 Low POM Bacteria and viruses (along with other POM) can be sequestered in, or mobilized from, the hyporheic zone
Habitat High Turbulent Stream Flow REDD Pressure Low The HZ also serves as habitat for plants, fish eggs (redd), and macroinvertebrates
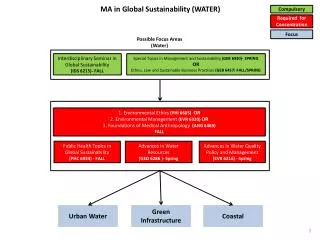
Hyporheic Zones: the next constructed wetland? Lawrence et al (2013) “Hyporheic Zone in Urban Streams: Review and Opportunities for Enhancing Water Quality and Improving Aquatic Habitat by Active Management” Environmental Engineering Management, 30: 480-501
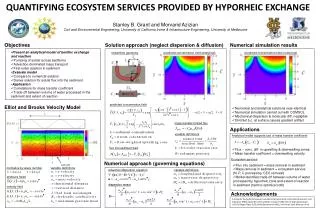
Goal: develop predictive tools of pollutant removal in the hyporheic zone • Theoretical studies of hyporheic exchange and pollutant removal (S. Grant, S. Elghobashi, I. Marusic, D. Chung, M. Azizian; A. Kalantari) • Laboratory-scale experimental studies of pollutant removal (P. Cook, A. Mccluskey) • Field-scale extrapolations of theoretical and lab-scale studies (M. Stewardson)
unit cell Figure 1.
A. B. first-order reaction in sediment domain D. C. Figure 2.
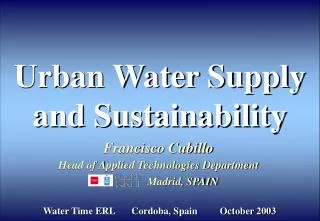
Modeling Drought Response at the City Scale Kathleen Low Stanley Grant
Melbourne decreased its per capita potable water consumption by a whopping 46% over 12 years (458 to 247 L/person-day)
Melbourne decreased its per capita potable water consumption by a whopping 46% over 12 years (458 to 247 L/person-day) =300 GL of water saved in 2012 >3X maximum annual capacity of OC GWRS (88 GL) >water supplied by LA Aqueduct in 2010/11 (228 GL)
Melbourne decreased its per capita potable water consumption by a whopping 46% over 12 years (458 to 247 L/person-day)! =300 GL of water saved in 2012 >3X maximum annual capacity of OC GWRS (88 GL) >water supplied by LA Aqueduct in 2010/11 (228 GL) How did Melbourne do it?
Participants Kathleen Low, Andrew Hamilton, David Feldman, Amir AghaKouchak, Murray Peel, Mike Stewardson