Download
1 / 30
300 likes | 450 Vues
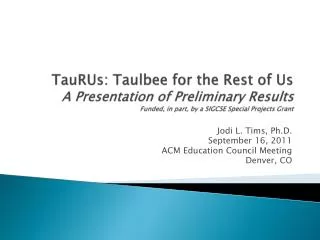
TauRUs : Taulbee for the Rest of Us A Presentation of Preliminary Results Funded, in part, by a SIGCSE Special Projects Grant. Jodi L. Tims, Ph.D. September 16, 2011 ACM Education Council Meeting Denver, CO. Goals of this Presentation. Explain the survey and present preliminary results

E N D
TauRUs: Taulbee for the Rest of UsA Presentation of Preliminary ResultsFunded, in part, by a SIGCSE Special Projects Grant Jodi L. Tims, Ph.D. September 16, 2011 ACM Education Council Meeting Denver, CO
Goals of this Presentation • Explain the survey and present preliminary results • Obtain feedback from this group for: • Improving the survey • Determining to whom the survey is of most interest and where it is best published • Finding a sponsoring organization for the survey going forward so that it can continue
Background • Survey developed Spring 2010 • Administered Fall 2010-Spring 2011 • Two additional co-authors • Susan Williams, Ph.D., Georgia Southern University • Michael Goldweber, Ph.D., Xavier University (OH) • Modeled closely after the Taulbee survey • Some significant differeinces from the Goldweber version published in Inroads, June 2011
Differences in TauRUs surveys • 2009-2010 survey included: • Work environment concerns • Teaching load • Publication expectations • Degree production history • 2010-2011 survey included: • Invitations to broader scope of schools • More types of programs (CS, CE, IS, IT vs. CS) • ABET accreditation information • Graduates entering Ph.D. • Undergraduate research info • Enrollment history
Identifying Schools • IPEDS database was queried for schools that had computing related programs – 1272 hits • Initial letter announcing the survey, its purpose, and how to access it was sent to all schools in October, 2010 • Multiple letters went to some schools if programs were in different colleges/divisions (~2500 total) • A reminder postcard was mailed about one month later • An announcement to the SIGCSE listserv was posted around Thanksgiving • Targeted emails to 250 respondents of Goldweber pilot, those with partial responses, and about 250 other randomly selected schools in April
Institutional Summary • 65 schools offering 119 undergraduate (24 ABET accredited) and 19 graduate computing programs • 17 public, 48 private • Mean undergraduate enrollment of all schools is 4054 (min of 500, max of 17340) • Mean graduate enrollment of 43 schools having some type of graduate program is 1237 (783 reported in computing masters programs) • Geographic distribution – 16 Northeast, 12 Southeast, 15 Midwest, 2 Southwest, 20 West
Programs Offered by Type Average programs per institution: 1.2 Average programs per institution: 1.
Graduates Entering Ph.D. Programs(5 Master’s and 29 Bachelor’s Programs Reporting Non-Zero Values)
Anticipated Degrees 2010-2011(14 Master’s and 61 Bachelor’s Programs Reporting Non-Zero Values)
Faculty Gender(63 schools reporting all faculty and 22 reporting new faculty)
Faculty Gender Comparison(62 schools reporting all faculty and 22 reporting new faculty)
Ethnicity of New Faculty by Rank(22 schools reporting non-zero values)
Ethnicity of Faculty Comparison(61 school reporting all faculty and 22 reporting new faculty)
Undergrad/Grad Institution Comparisons(47 Undergrad and 16 Grad Program reporting)
Undergrad/Grad ComparisonFaculty Minority Percentages(47 Undergraduate and 17 Grad Programs Reporting)
Faculty Salary Summary(64 schools reporting) *Taulbee non-TT data includes teaching and research faculty and post-doctorates
What’s Next for TauRUs • Dissemination of 2010-2011 results • Prepare for next survey administration • Database creation • Email distribution of invitation • Modify/add questions • Find TauRUs a permanent home and administrator • http://mcs.bw.edu/Taurus/Survey.pdf