Water Balances Optimization for Sustainable River Basin Management
Learn about the ABOT Project's water balance assessment and optimization for sustainable water management in Europe, focusing on preventive actions to halt desertification. Explore the impacts of demand management measures on water scarcity and the efficacy of sector-specific targets.

Water Balances Optimization for Sustainable River Basin Management
E N D
Presentation Transcript
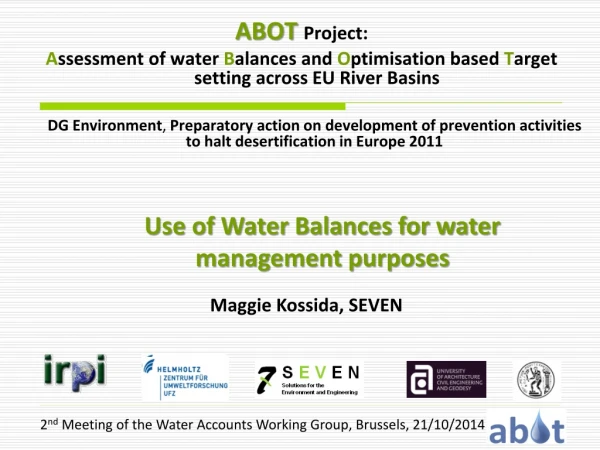
DG Environment, Preparatory action on development of prevention activities to halt desertification in Europe 2011 ABOT Project: Assessment of water Balances and Optimisation based Target setting across EU River Basins • Use of Water Balances for water management purposes Maggie Kossida, SEVEN
ABOT Project Specific Objectives • Assess: Collect, process and analyse the necessary datasetsfor the development of the water balances in the 4 pilot RBs • Balance:Develop detailed water resources balances based on the SEEAW and using an analytical physical based model (WEAP21) to capture the interactions of the components of the water cycle. Identify demand management measures (involving local stakeholders) that can improve the water balance and alleviate the possible deficit between availability and demand • Optimise: Simulate theimpact & effectiveness of the measures against specific criteria,build and run an optimisation process under specific constraints to select the optimum measures against a specific objective function • Target: Derive sector specific targets (regarding water saving, water-reuse, etc.) which allow the preservation and/or restoration of the natural water balance. Run a sensitivity analysis for these proposed targets for 3 alternative future scenarios
Schematical layout of the core idea - Simulation and testing of demand reduction measures - Selection of measures and definition of targets based on cost-benefit optimisation
The tested measures • URBAN SECTOR • Dual flush toilets • Low flow taps/showerheads replacement • Efficient washing machine • Installation of Pressure Reducing Valves (PRV) • Active Leakage Control (ALC) • Leakage reduction (repairs, replace old pipes) • Rainwater Harvesting • Greywater Reuse • AGRICULTURAL SECTOR • Leakage repairs • Improved conveyance (switch from open channels to closed pipes) • Improved irrigation methods (furrow to sprinklers to drip) • (repairs, replace old pipes) • Precision agriculture • Deficit irrigation • Cultivated land reform
1. Ali-Efenti Pinios RB Greece • Tributary of the Pinios River • Frequent Drought episodes, increased risk of water scarcity • Extended irrigation areas (cotton, maize, sugar beets, alfalfa), low irrigation efficiency • Imbalance between demand and availability is frequent. Competing uses, July irrigation deficit 114hm3 • Over-abstraction has led to environmental impacts (declining groundwater levels) • Operational DMPsor other policy instruments are lacking, • “crisis management” rather than on a pro-active and preparedness approach.
How did the development of Water Balances support local water management ? • WB provided the necessary input for the development of a cost-effective optimum water allocation schema among the users, considering the spatial and temporal availability of water resources. • By identifying the imbalances across the water quantity components and the related drivers and pressures (which can consequently also impact water quality) robust targets were established. • WB guided the development of a series of demand reduction measures and interventions which are based on a holistic assessment and can mitigate water stress on the short and long-term. • Projected WB as calculated for 3 future climate and socio-economic scenarios were used to test the robustness of the selected measures, supporting thus climate change adaptation.
Water Balance & Unmet Demand Unmet Irrigation demand Unmet Industry demand Unmet Livestock demand
The selected solution(s) • Optimisation scenario A indicates 18% reduction of unmet demand with AEC 12 mio €. Higher investment has insignificant additional impact • Optimisation scenario B indicates that using deficit irrigation the unmet demand is dramatically reduced – albeit with a cost to production and thus farmers’ income. A 78% reduction of unmet demand with AEC 11.5 mio € can be achieved, higher investment has insignificant additional impact • Interventions in the urban sector have a less pronounced role (not preferred by the algorithm). Savings of 7.5% can be achieved, above this level (up to 26%) it is very costly and entails the inclusion of RHW, GWR and efficient washing machines. • Without applying any of the selected solutions, and only by reforming the cultivated land a reduction of unmet demand from 32.95 hm3 to 11.32 hm3 can be achieved (66% reduction). Cultivated Land Reform: 15% of cotton cultivation replaced by aloe vera 5% of maize replaced by broccoli 10% of maize replaced by kiwi
2. Middle Tiber RBItaly • Drought conditions (2002, 2008) • Impact on springs, lakes, groundwater • High losses (~ 40%) • Affected water uses: drinking, irrigation, tourism • Over-explotation of GW resources, illegal abstractions
How did the development of Water Balances support local water management ? • To decrease the unmet demand, (mainly in the urban site), the implemented WB allowed the development of a cost-effective optimum water allocation schema among the users. • Based on that, different measures and interventions were suggested to the stakeholders in charge of the water resources management for the maximization of the unmet water demand reduction with the minimum possible investment. • Robustness was evaluated for three different future climate and socio-economic scenarios
Water Balance & Unmet Demand Monthly Unmet Demand per Node 2008-2011 Total Unmet Demand 2008-2011 per sector Unmet demand = 28.72 Mm3. The max optimal investment can reduce it to 22.52 Mm3 (22% reduction) with an optimal combination of the simulated measuresand a cost of 44.2 M€
3. Mulde RB Germany • Major tributary of the Elbe • Increasing drought trends • Impacts on agriculture (25% loss of yield), forestry, soil protection, reservoir management • There is no actual severe water availability issue in the Mulde catchment as the water supply system is highly managed (mainly by 15 reservoirs which are partly interconnected due to a remote water supply system) • Nevertheless, climate change predictions suggest drought risks which may force the dominantly rain fed agriculture towards irrigation systems, which in turn may lead to water-related competitions and conflicts on a long term perspective. • farmers and policy makers should develop strategies to face future water shortage together with a potential supply priority plan.
3. Mulde RB Germany The development of WB supported the understanding of the water supply structure and allowed to establish a model that is capable: i) to simulate the multi-scale impact of measures, ii) to highlight the spatial distribution of future risks (impact of climate change projections) iii) to suggest corresponding adaptations. Furthermore, we were able to incorporate WBs in a comprehensive model structure as a powerful tool to link water demand and supply to socio-economic factors and investigate the systems cost efficiency.
Water Balance & Unmet Demand The highly managed Mulde catchment has no problem with unmet demand even under future climate change (A1B) Reservoirs - SupplyCapacitieswere not limited and proved sufficient buffer effect Reasons: - Management was planed for much larger populations and higher demand due to the former mining activities - Water consumption and demand per person decreased due to a long tradition of costumer sensitization mainly reached by the high political water pricing - Agriculture is rainfed Rainwater Harvesting Additional benefits: - Regionalise water supply and thus reduce supply costs and water price - Buffer large ammounts of runoff in urban areas, feedback to floods - Reduce peak flows in the sewage while the minimum flows will remain adequate • Yet, it is unrealistic to assume that the measure will be implemented, due to: • - Legal issues: (since sewerage costs in Germany are calculated by the input, a RWH system will make it almost impossible to be checked) • - High Investment costs: 1 m3 would cost 20-133 €as opposed to 2€from the PWS
Tributary of Danube • Variability between high and low flows, droughts are usual • Main pressures: logging, agriculture, recreational activities, industry, and the settlements within the river valley 4. Vit RB Bulgaria
Water Balance & Unmet Demand Monthly unmet demand in Iskar town for the year 2009 Monthly unmet demand in Pleven town for the year 2011 With relatively low investments up to 1.5 mio EUR the water saved is 35 mio m3 (= 14% of the abstracted water). Beyond this the effect of the measures is insignificant.
Lessons learned (water balance & SEEAW) • The outputs of the exercise are detailed WB at monthly level in each pilot RB, with complex hydrological features, different type of water users, and many connections from multiple sources to users to return nodes. Setting up such detailed models, can be a quite complex task, especially if the necessary data are not readily available (or are in different spatial and temporal scales, thus aggregation techniques and proxies were necessary) • The SEEAW tables are, in principle, designed to be filled by statistically collected data. Yet, many of the requested parameters in the SEEAW tables cannot simply be obtained as products of reporting but require the set‐up and output of a detailed water management model. For the purpose of developing EU water balances and capturing the quantitative status of the water resources the tables are too detailed and some of the requested information is practically not policy relevant and very difficult to obtain. Thus, aggregating some parameters of the tables (with streamlined definition) and deriving, on this basis, meaningful indicators to be reported is advised. • The WEAP model can easily support the production of Water Accounts under the SEEAW methodology (matching WEAP parameters with SEEAW cells/ export function) . Flexibility and applicability even for watersheds with limited available information. Nice visualization tools easy production of graphs . The scenario building functionscan facilitate the evaluation of alternative options and scenarios • The WEI+ is good for assessing the water stress, but additional indicators are useful: unmet demand , demand site reliability. Yet, which are the “sectors/unit to blame”?. So, additional sector specific indicators are needed: avoidable water losses in the urban supply network, irrigation efficiency, etc. These two sets of the indicators serve as a base for selection of appropriate mitigation and response measures
Lessons learned (measures, optimization & targets) • The procedure was successfully implemented in the 4 RBs. It was concluded that modeling inWEAP21coupled with Evolutionary Programming (GA) optimisation in Matlab, provides a robust and powerful toolfor cost-effective interventions optioneering. • The generation of reliable intervention curves, that represent the tradeoff between investment cost and water saving effect, requires extensive data related to: • - the target domain or engineering object (water distribution network, irrigation system, etc.) • - the effect of each measure • - up‐to‐date information on the operation, management and investment costs. • The approach however is flexible and robust enough to be able to incorporate engineering judgment and domain/case-specific knowledge into the optimisation process. • When more than one measure is relevant for the same object (e.g water supply network, irrigation water network, etc.), depending on the mutual interrelations between the effects of these measures, two approaches are possible for their prioritization: • 1) when the effects of the measures are interrelated, they should be prioritized by expert judgment; • 2) if the application of one of the measures does not influence the effect of the application of the others, then (direct) optimization is a useful tool for performing the prioritization analysis.
Thank you!mkossida@seven-solutions.eu Contact Info: