Drawing
Learn about the principles and process modeling involved in bulk drawing, mechanics of metal forming, drawing stress, parameters like area reduction and draft, limits of drawing, and an example calculation for maximum speed in the drawing process.

Drawing
E N D
Presentation Transcript
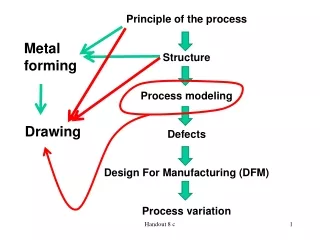
Principle of the process Structure Process modeling Defects Design For Manufacturing (DFM) Process variation Metal forming Drawing Handout 8 c
Bulk Drawing: Process modeling 1. Introduction In the bulk deformation processes, drawing is an operation in which the cross section of a bar, rod, or wire is reduced by pulling it through a die opening, as shown in Figure 1. Handout 8 c
Extrusion Drawing Has pushing force Has pulling force Figure 1 here Handout 8 c
2. Objectives of the Modeling Rolling process Drawing process Torque (force) Power Velocity (productivity) Max draft Pulling force Power Pulling velocity Max draft Handout 8 c
3. Mechanics Phenomenon There is a tensile stress at the right side of the exit due to pulling force, but compression plays a major role since the metal is squeezed to pass through the die opening. Handout 8 c
r=(A0-Af)/A0 4. Parameters r: area reduction A0: initial area of work Af: final area d=D0-Df, draft Drawing stress Contact length Die angle Friction between work and die Force Handout 8 c
Accounts for inhomogeneous deformation 5. Drawing stress, drawing force, power r=(A0-Af)/A0 Handout 8 c
5. Drawing stress, drawing force, power Handout 8 c
6. Limit of Drawing • Allowable power • Yield stress • Maximum power < Allowable power of a drive system • Maximum stress < Yield stress Otherwise, material enters a plastic region at the exit, and no “drawing” but “elongation” occurs • Remark: • Reduction or reduction rate (r) increases Power increases and stress at the exit increases. • If one pass does not achieve a desired reduction, try several passes. Handout 8 c
6. Finding Max draw stress & Max reduction (1 pass) Assumption: no friction, no strain hardening (n=0), no redundant work (perfectly plastic), no power capacity limit Critical point: Max. draw stress = Yield Strength Also, because (n=0) Handout 8 c
Example Wire stock of initial diameter = 0.125 in is drawn through two dies, each providing a 0.20 area reduction rate (r). The starting metal has a strength coefficient = 40,000 lb/in2 and a strain hardening exponent =0.15. Each die has an entrance angle of 12o, and the coefficient of friction at the work-die interface is estimated to be 0.10. The motors driving the capstans at the die exits can each deliver 1.50 hp at 90% efficiency. Determine the maximum possible speed of the wire as it exits the second die. Handout 8 c
At the exit of the first die Handout 8 c
At the exit of the second die Handout 8 c
From this calculation, the velocity of the second die is the limiting velocity. That is to say, the velocity of the whole system should take 3.47 ft /s. • As a result, • the first operation would have to be operated at well below its maximum possible speed; or • the second draw die could be powered by a higher horsepower motor; or • the reductions to achieve the two stages would be reallocated to achieve a higher reduction in the first drawing operation. Line balancing Handout 8 c