Download
1 / 48
480 likes | 502 Vues
Explore the world of data warehousing and relational databases, learn about metadata, SQL, and business intelligence. Understand the importance of designing and building efficient data warehouses to enhance decision-making processes. Discover how different vendors offer solutions in this field.

E N D
MBA 7025Statistical Business AnalysisData Warehousing & Data Mining Mar 24, 2015
Data Warehouse & Relational Database Agenda Designing & Building the Data Warehouse Data Mining Appendix: SQL
The Data Warehouse • The Data Warehouse • is physically separated from all other operational systems • holds aggregated data and transactional data for management separate from that data used for online transaction processing
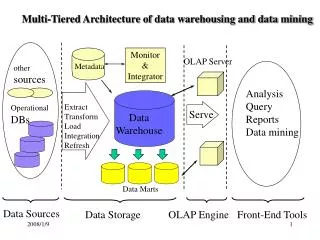
Data Flow Operational Data Store Data Warehouse Personal Data Warehouse Legacy Systems Data Mart Metadata
Metadata • What is Metadata? • Data about Data • Without metadata, the data is meaningless • Provides consistency of the truth • Components of Metadata • Transformation Mapping • Extraction and Relationship History • Algorithms for Summarization (and calculations) • Data Ownership • Patterns of Warehouse Access • Business Friendly naming conventions • Status Information
Data Warehouse Vendors • Business Objects • Cognos • Hyperion • IBM • Microsoft • NCR / Teradata • Oracle • SAS
Relational Database • A relational database is a collection of data items organized as a set of formally-described tables from which data can be accessed or reassembled in many different ways without having to reorganize the database tables. The relational database was invented by E. F. Codd at IBM in 1970. • The standard user and application program interface to a relational database is the structured query language (SQL). SQL statements are used both for interactive queries for information from a relational database and for gathering data for reports. • A relational database is a set of tables containing data fitted into predefined categories. Each table (which is sometimes called a relation) contains one or more data categories in columns. Each row contains a unique instance of data for the categories defined by the columns. For example, a typical business order entry database would include a table that described a customer with columns for name, address, phone number, and so forth. Another table would describe an order: product, customer, date, sales price, and so forth. A user of the database could obtain a view of the database that fitted the user's needs. For example, a branch office manager might like a view or report on all customers that had bought products after a certain date. A financial services manager in the same company could, from the same tables, obtain a report on accounts that needed to be paid.
Relational Database When creating a relational database, you can define the domain of possible values in a data column and further constraints that may apply to that data value. For example, a domain of possible customers could allow up to ten possible customer names but be constrained in one table to allowing only three of these customer names to be specifiable. The definition of a relational database results in a table of metadata or formal descriptions of the tables, columns, domains, and constraints. Meta is a prefix that in most information technology usages means "an underlying definition or description." Thus, metadata is a definition or description of data and metalanguage is a definition or description of language. A database is a collection of data that is organized so that its contents can easily be accessed, managed, and updated. The most prevalent type of database is the relational database, a tabular database in which data is defined so that it can be reorganized and accessed in a number of different ways. A distributed database is one that can be dispersed or replicated among different points in a network. An object-oriented programming database is one that is congruent with the data defined in object classes and subclasses. SQL (Structured Query Language) is a standard interactive and programming language for getting information from and updating a database. Although SQL is both an ANSI and an ISO standard, many database products support SQL with proprietary extensions to the standard language. Queries take the form of a command language that lets you select, insert, update, find out the location of data, and so forth.
Business Intelligence Environment Internal Source Systems Data Warehouse Data Mart Extract, Transformation and Load External Data Sources
Relational Database • IBM DB2, DB2/400 • Microsoft SQL/Server • Teradata • Oracle • Sybase • Informix / Red Brick • Microsoft Access • MySQL
SQL • SQL – Structured Query Language • DDL – Data Definition Language • Create • Drop • Alter • DML – Data Manipulation Language • Insert • Update • Delete • Select
Relational Database SQL Request RDBMS Software Application Result Set
Data Warehouse & Relational Database Agenda Designing & Building the Data Warehouse Data Mining Appendix: SQL
Why Business Intelligence • Improve consistency and accuracy of reporting • Reduce stress on operational systems for reporting and analysis • Faster access to information • BI tools provide increased analytical capabilities • Empowering the Business User • Companies are realizing that data is a company’s most underutilized asset
ERM vs. DM • ERM - Entity Relationship Model • Remove redundancy • Efficiency of transactions • DM - Dimensional Model • Intuitive View of the Data • Efficiency of access and analysis
Fact Table • Contains Foreign Keys that relate to Dimension Tables • Have a many-to-one relationship to Dimension Tables • Contains Metrics to be aggregated • Typically does not contain any non-foreign key or non-metric data elements • Level of Granularity defines depth and flexibility of analysis
Dimension Table • Contains a Primary Key that relates to the Fact Table(s) • Has a one-to-many relationship to the Fact Table(s) • Contains Descriptive data used to limit and aggregated metrics from the Fact Table(s) • Can sometimes contain pre-aggregated data
Data Warehouse & Relational Database Agenda Designing & Building the Data Warehouse Data Mining Appendix: SQL What is Data Mining? Market Basket Analysis Marketing Analytics – Direct Marketing Campaign Cluster Analysis
What is Data Mining? • A set of activities used to find new, hidden, or unexpected patterns in data • Verification versus Discovery • Accuracy in predicting consumer behavior
Data Warehouse / Data Mart RDBMS OLAP – Online Analytical Processing • MOLAP – Multidimensional OLAP • ROLAP – Relational OLAP
Limitations of Data Mining • All relevant data items / attributes may not be collected by the operational systems • Data noise or missing values (data quality) • Large database requirements and multi-dimensionality
Techniques and Technologies • Techniques Used to Mine the Data • Classification • Association • Sequence • Cluster • Data Mining Technologies • Statistical Analysis • Neural Networks, Genetic Algorithms and Fuzzy Logic • Decision Trees
General Data Mining Methods • Predicting which customers will purchase, based on demographics, psychographics, firmographics, service history, transactions, credit history, etc. Statistical algorithms and decision trees are used for these problems with much success. • Market Basket Analysis: which customers who purchase an additional telephone line are also likely to purchase dialup internet service? Pattern matching works well: associative rules, fuzzy logic, neural networks. • Which types of activities precede each other; eg, do customer hospitality and gaming activities show patterns or sequences? We use a combination of statistical modeling and simulations to identify these trigger points for action, and to estimate the marginal value of each. • Clustering is useful for determining similar groups based on how closely they resemble each other. Multitude of clustering techniques exist, with the primary difference being in how they define what is “close”. Clustering can be very useful for marketing messaging and advertising, strategy development and implementation, and channel development. Classification: Association: Sequencing: Clustering:
Analytics Process DATA KNOWLEDGE LEVERAGING POST DISCOVERY PREPARATION DEVELOPMENT ANALYTICS ANALYSIS FEEDBACK IDENTIFYING HYPOTHESIS CUSTOMER TESTING DATA WAREHOUSE OPPORTUNITIES BEHAVIOR RESULTS SCORING EXTERNAL DATA DECOMPOSITION SCOPING STATISTICAL APPEND DIRECT MAIL EFFORT MODELING TELEMARKETING OBJECTIVE DATA EXTRACTION FEEDBACK FOR SEGMENTATION EMAIL SETTING REFINING ANALYTICS LOYALTY DEVELOPING DATA VALIDATION OFFER CAMPAIGN HYPOTHESES OPTIMIZATION
Market Basket Analysis • Market Basket Analysis • Most common and useful in Marketing • What products customers purchase together Diapers and Beer sell well on Thursday nights • Benefits • Better target marketing • Product positioning with stores (virtual stores) • Inventory management • Limitations • Large volume of real transactions needed • Difficult to correlate frequently purchased items with infrequently purchased items • Results of previous transactions could have been affected by other marketing promotions
Market Basket Analysis • Association Rules for Market Basket Analysis • All associations are unidirectional and take on the following form: • Left-hand side rule IMPLIES Right-hand side rule • Left and Right hand side can both contain multiple items (Multi-dimensional Market Analysis) • Examples: Steak IMPLIES Red Wine Hunting Magazines IMPLIES Smokeless Tobacco
Market Basket Analysis • 3 Measures of Market Basket Analysis • Support – the percentage of baskets in the analysis where the rule is true • Of 100 baskets 11 contained both steaks and red wine. • 11% support • Confidence – the percentage of Left-hand side items that also have right-side items • Of the 17 baskets that contained steak, 11 contained red wine. • 65% confidence • Lift – compares the likelihood of finding the right-hand item in any random basket • Also referred to as Improvement • Lift of less than 1 means it is less predictive than random choice • If Confidence is 35%, but the right-hand side items is in 40% of the baskets, the rule offers no Improvement of random selection.
Market Basket Analysis • Market Basket Analysis results can be: • Trivial • Hot Dogs IMPLIES Hot Dog Buns • TV IMPLIES TV Warranty • Inexplicable Virtual Items – Associating non-items or other attributes into the correlation study “New Customer”
Strategy & Tactics: Guiding the business & helping to make numbers Business Planning, Forecasting, Corp Strategy, Financial Metrics, Profitability Analysis Acquisition Growth Retention Reacquisition Where can I find more revenue & profit from my current customers? Which of my customers are at risk and how can I keep them? Which customers do I want to win back? Where can I find new customers? • Propensity to buy & response modeling • Marketing Optimization • Market Basket Analysis • Online and Retail Channels • Customer and product churn modeling • Retentive stickiness of key products • Prediction of key events (eg, residential movers) • Customer Acquisition • Prospect profiling • Event driven marketing • Customer reacquisition • Customer profitability analysis Customer Knowledge – Who are my customers? Segmentation & Profiles, External Data, Mkt Share/Wallet Share, Channel Preference Modeling Marketing Analytics Landscape
Cluster Analysis • Definition: The identification and grouping of consumers that share similar characteristics • Yields: better understanding of prospects/customers • Translates into: improved business results through revised strategies attributes • Definition: The identification and grouping of consumers that share similar characteristics • Process: • Data Selection • Missing Values • Standardization • Removal of Outliers • Cluster Analysis Considerations
Cluster Analysis • Only want a small subset of variables for clustering • Weed out undesirable variables • Can use PROC FACTOR, PROC CORR • Can use expert system • Consideration for observations, weighting • Probably done with factor analysis • If not, then two options • Set Missing to Mean of data • Set Missing to Value of Equivalent Performance • No right or wrong answer • Might do both - depending on variables
Clustering Midscale / Business Traveler Midscale / Leisure Traveler Upscale / Business Traveler – Loan Dependent Upscale / Leisure Traveler Prospect Base Country Club / Resort Set Upscale / Business Traveler – Prosperous Traveler Other
Attribute Cluster Name A B C D E (ALL) Age of Head of Household 38 62 48 44 52 43 Length of Residence in high income group zip codes 7 12 9 6 7 7 Household Income (,000) 48 45 102 73 71 72 Weekday Check in 13 1 3 6 2 3 Weekend Check in 69 6 29 51 7 30 No. Stays (resort) between Jan 1, 2001 and Jun 30, 2002 0 5 6 5 3 2 No. Stays (mid properties) between Jan 1, 2001 and Jun 30, 2002 11 55 21 15 32 16 No. Stays (upscale properties) between Jan 1, 2001 and Jun 30, 2002 24 2 10 15 8 7 Cluster Analysis
Cluster Analysis Cluster 1 Cluster 1 Cluster 1 ------------ Calculate Scores (ROI, Response, Utilization) Overlay Profitability Estimate High RETURN Low Evaluate Risk-Return Tradeoff (by Offer and by Cluster) Low Mail RISK Make Final Selections No-Mail High DM/Offer 1 DM /Offer 2 DM /Offer N --------
Data Warehouse & Relational Database Agenda Designing & Building the Data Warehouse Data Mining Appendix: SQL
SQL Select Statement SELECT column1, column2, . . . FROM table1, table2, . . . WHERE criteria1 AND/OR criteria2 . . . . . ORDER BY column1, column1, . . .
SQL Select Statement SELECT column1, column2, . . . FROM table1, table2, . . . WHERE criteria1 AND/OR criteria2 . . . . . GROUP BY column1, column1, . . . HAVING criteria1 AND/OR criteria2 . . . . . Aggregation ORDER BY column1, column1, . . .
SQL – Example 1 SQL CREATE TABLE ADDR_BOOK ( NAME char(30), COMPANY char(20), E_MAIL char (25) Output Name Company Email John Smith Microsoft john.smith@microsoft.com Jeff Jones Delta jeffjones@delta.com
SQL – Example 2 2a) SQL SELECT NAME, COMPANY, E_MAIL FROM ADDR_BOOK WHERE COMPANY = ‘Microsoft' Output Name Company Email John Smith Microsoft john.smith@microsoft.com 2b) Table - Product ID Name Category I Internet A B Browsers A A Application Null G Graphics Null SQL SELECT ID, NAME from PRODUCT WHERE CATEGORY = NULL
SQL – Example 3 SQL SELECT ADDR_BOOK.NAME, COMPANY.EMAIL FROM ADDR_BOOK, COMPANY WHERE ADDR_BOOK.EMPLOYEE_ID = COMPANY.EMPLOYEE_ID Output Name Email John Smith john.smith@microsoft.com Jeff Jones jeffjones@delta.com
SQL – Example 4 SQL CREATE TABLE CUSTOMER ( CUST_NO INTEGER, FIRST_NAME CHAR(30), LAST_NAME CHAR(30), ADDRESS CHAR(50), CITY CHAR(30), STATE CHAR (2), ZIP_CODE CHAR(9), COUNTRY CHAR(20) ) CREATE TABLE ORDER ( ORDER_NO INTEGER, DATE_ENTERED DATE, CUST_NO INTEGER ) SQL SELECT ORDER.ORDER_NO, CUSTOMER.NAME, CUSTOMER.ADDRESS, CUSTOMER.CITY, CUSTOMER.ZIP_CIDE, CUSTOMER.COUNTRY FROM ORDER, CUSTOMER WHERE ORDER.CUST_NO = CUSTOMER.CUST_NO AND ORDER.DATE_ENTERED = '1998-20-11'
SQL – Example 5 SQL CREATE TABLE ADDR_BOOK ( NAME char(30), COMPANY char(20), E_MAIL char (25) Output Name Company Email John Smith Microsoft john.smith@microsoft.com Jeff Jones Delta jeffjones@delta.com
SQL – Example 6 – Referential Integrity SQL CREATE TABLE CUSTOMER ( CUST_NO INTEGER PRIMARY KEY, FIRST_NAME CHAR(30), LAST_NAME CHAR(30), ADDRESS CHAR(50), CITY CHAR(30), ZIP_CODE CHAR(9), COUNTRY CHAR(20) ) CREATE TABLE ORDER ( ORDER_NO INTEGER PRIMARY KEY, DATE_ENTERED DATE, CUST_NO INTEGER REFERENCES CUSTOMER (CUST_NO) ) SQL CREATE TABLE ORDER_ITEMS ( ORDER_NO INTEGER, ITEM_NO INTEGER, PRODUCT CHAR(30), QUANTITY INTEGER, UNIT_PRICE MONEY ) ALTER TABLE ORDER_ITEMS ADD PRIMARY KEY PK_ORDER_ITEMS (ORDER_NO, ITEM_NO) ALTER TABLE ORDER_ITEMS ADD FOREIGN KEY FK_ORDER_ITEMS_1 (ORDER_NO) REFERENCES ORDER (ORDER_NO)
SQL – Example 7 – Index When you have a primary key, you already have an implicitly (or explicitly) defined unique index on the primary key columns. It's generally a good idea to define non-unique indexes on the foreign keys. SQL CREATE UNIQUE INDEX PK_CUSTOMER ON CUSTOMER (CUST_NO) CREATE UNIQUE INDEX PK_ORDER ON ORDER (ORDER_NO) CREATE INDEX FK_ORDER_1 ON ORDER (CUST_NO) CREATE UNIQUE INDEX PK_ORDER_ITEMS ON ORDER_ITEMS (ORDER_NO, ITEM_NO) CREATE INDEX FK_ORDER_ITEMS_1 ON ORDER_ITEMS (ORDER_NO)