Download
1 / 4
40 likes | 57 Vues
Learn how to create a thermometer chart in Excel with detailed instructions. Design a visual representation using shapes and colors for clear data presentation.

E N D
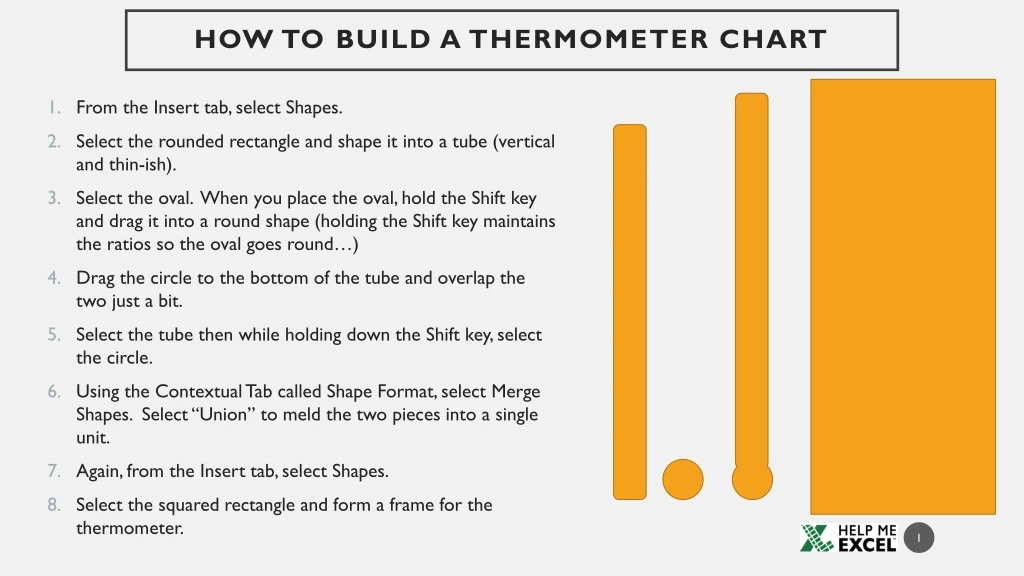
How to Build a Thermometer Chart • From the Insert tab, select Shapes. • Select the rounded rectangle and shape it into a tube (vertical and thin-ish). • Select the oval. When you place the oval, hold the Shift key and drag it into a round shape (holding the Shift key maintains the ratios so the oval goes round…) • Drag the circle to the bottom of the tube and overlap the two just a bit. • Select the tube then while holding down the Shift key, select the circle. • Using the Contextual Tab called Shape Format, select Merge Shapes. Select “Union” to meld the two pieces into a single unit. • Again, from the Insert tab, select Shapes. • Select the squared rectangle and form a frame for the thermometer.
How to Build a Thermometer Chart • Select the Thermometer. • From the Contextual tab, in the Shape Styles section, select Shape Fill and select “No Fill”. • From the Contextual tab, in the Shape Styles section, select Shape Outline and select Black. • Select the Frame. • From the Contextual tab, in the Shape Styles section, select Shape Fill and select “No Fill”. • From the Contextual tab, in the Shape Styles section, select Shape Outline and select Black, then select the Weight and choose a heavier weight (2.5) for the Frame’s border. • Move and center the Thermometer into the Frame. • Select the tube then while holding down the Shift key, select the Frame. • Using the Contextual Tab called Shape Format, select Merge Shapes. Select “Combine” to cut out the Thermometer shape into the Frame. Shape Fill White.
Hawai’i Bound How to Build a Thermometer Chart 100% 75% 100% 75% • Again, from the Insert tab, select Shapes. Select the line (no arrows). Resize the lines to about 1.25 times the width of the Thermometer. • Copy and paste 4 additional copies of the lines. • Again, from the Insert tab, select Shapes. Select the Text Box and copy and paste 5 additional copies. Fill each of the text boxes with 100%, 75%, 50%, 25%, 0% (individually). The 6th Text Box is a for a Chart Title should you want to use one. • Place one of the 5 lines horizontally at the top and thru the Thermometer (100%) and another line horizontally just above and thru the bowl portion of the Thermometer (0%). • Place the 3 remaining lines in places that approximate 75%, 50% and 25% points on the Thermometer. • Using the Shift key, select all five lines. From the Contextual tab, in the Arrange section, select Align and then Align Right. This will align all the lines to the line set to the farthest right. Keeping the lines highlighted, select Align again and then select Distribute Vertically. This will distribute all 5 lines equally and vertically based on the prior placement of the top and bottom lines. • Align the text boxes to their appropriate spots as well as the Chart Title. • Again, from the Insert tab, select Shapes. Select the Square and form it to be a bit larger than the bowl of the Thermometer. • From the Contextual tab, in the Shape Styles section, choose Shape Fill and fill the square red (make note of the color red) • Move the red square over the bowl portion of the Thermometer. From the Contextual tab, in the Arrange section, select Send Backward and then “Send to Back”. • Highlight all the elements. From the Contextual tab, in the Arrange section, select Group then Group. 50% 50% 25% 0% Hawai’i Bound 25% 0%
Hawai’i Bound How to Build a Thermometer Chart 100% 75% • At this point you’re ready to move your Thermometer to Excel. • Highlight the Thermometer, now a single unit because you’ve “Group”ed it and copy it to your Excel Workbook. • While in Excel: • Insert Data Bars via Conditional Format • Ensure color match • Custom Format “;;;” (Stealth Mode) • Copy/Paste Special Link Picture • Rotate data bar to vertical • Place in thermometer • Send Backward, “Send to Back” • Select all of the thermometer and Group 50% 25% 0%