Download
1 / 52
520 likes | 539 Vues
Dive into the economic landscape of Southern California with insights on job growth, industrial markets, real estate trends, and more. Discover how various sectors are impacting the region's prosperity. Stay informed to make informed decisions.

E N D
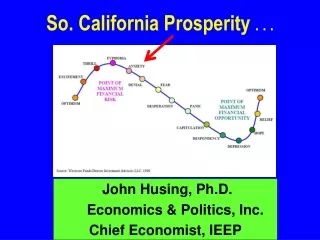
So. California Prosperity . . . John Husing, Ph.D. Economics & Politics, Inc. Chief Economist, IEEP
17.9% Add Potential Workers: Given Up Or Part Time 10.1% 6.9% 3.6%
Inflation: NOT MUCH! 3.3% 2.0%
Interest Rates: A Short Term Rate Decrease? 4.12% 2.50%
Yield Curve: Potential Recession Predictor Recession: 2020 Likelihood An Issue 2 Year to 10 Year 0.22%
Four Southern County Economy Gaining Strength! 2011-2018 Add +1,212,300 Jobs 8.3% Above 2007 Level 2008-2010 Lost -625,500 Jobs
Unemployment Rates March 2019
Gold Mine Theory Secondary Tier Primary Tier
E-Commerce 14.5%
Logistics Powerful Job Growth • 2011-2018 • 13.2% of New Jobs
CA Electrical Cost +88.0% +127.8%
Manufacturing Jobs • 2011-2018 • -0.9% of Job Growth
Net Industrial Absorption 21.9 million
Industrial Rates & Vacancies Lease Rates Per Square Foot Per Month, March-2019 Central Valley $0.46 6.0% Inland Empire $0.58 3.6% Ventura $0.87 1.5% Los Angeles $0.88 1.4% Orange $0.92 2.4% San Diego $0.98 4.2% Source: CB Richard Ellis
New Home Sales Volumes -35.2% -35.2% -34.1% -29.8% -47.8%
Existing Home Sales Volumes -14.0% -12.9% -9.4% -5.3% -18.0% -16.9%
Professionals & Mgmt., Higher Ed., Utilities, Information & Government 2011-2018 13.5% of Growth
Construction Jobs • 2011-2018 • 10.3% of Job Growth
Health Care Jobs: Continuous Growth • 2011-2018 • 12.0% of Job Growth
Population Serving Sectors E-commerce death High End Consumers Still Doing Well 3rd Strongest Inland Sector
Retail Jobs: An Issue • 2011-2018 • 15.5% of Job Growth • 2011-2018 • 6.1% of Job Growth