Download
1 / 5
50 likes | 232 Vues
Advanced Algebra II Notes 2.3 Histograms and Percentile Ranks. Histograms: Bins: Bar graph: Bars: Cluster in the data: Gaps : Use data on page 95. Enter Percent change in List 1. Use data on page 95. Enter Percent change in List 1. Press 2 nd y= (STAT PLOT)

E N D
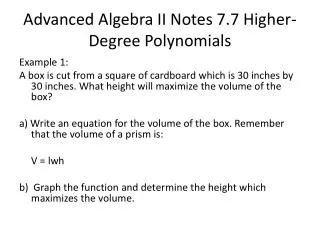
Advanced Algebra II Notes 2.3 Histograms and Percentile Ranks Histograms: Bins: Bar graph: Bars: Cluster in the data: Gaps: Use data on page 95. Enter Percent change in List 1.
Use data on page 95. Enter Percent change in List 1. • Press 2nd y= (STAT PLOT) • Turn it on and go to type histogram • x list is list 1, frequency is 1 • Zoom 9 • Use Trace to determine number of values in each interval • Check WINDOW to see the intervals • Change the intervals and see the effect on the graph • Sketch the graph with the scale below
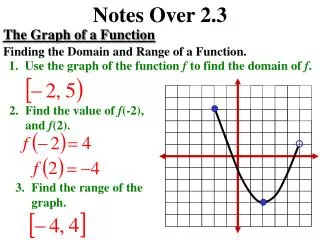
Answer the questions in Example A. Percentile rank: Skewed: Example B: page 98
Assignment: page 100: 1 – 8, 10