QQ Plot
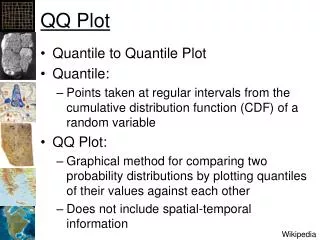
QQ Plot. Quantile to Quantile Plot Quantile: Points taken at regular intervals from the cumulative distribution function (CDF) of a random variable QQ Plot: Graphical method for comparing two probability distributions by plotting quantiles of their values against each other


QQ Plot
E N D
Presentation Transcript
QQ Plot • Quantile to Quantile Plot • Quantile: • Points taken at regular intervals from the cumulative distribution function (CDF) of a random variable • QQ Plot: • Graphical method for comparing two probability distributions by plotting quantiles of their values against each other • Does not include spatial-temporal information Wikipedia
Quantiles • If the data set have 10 values of: • 3, 6, 7, 8, 8, 10, 13, 15, 16, 20 • 4 quantiles would result in: • 10 x ¼ = 2.5, rounded to 3 => 7 • 10 x ½ = 5 => 8 • 10 x ¾ = 7.5, rounded to 8 => 15
Resampling • Bootstrapping • Drawing sets of samples, with replacement from the original dataset • Different results each time • Jackknifing • Repeat the estimation leaving out part of the dataset each time • Repeatable • Work with any interpolation or trend-surface method