Download

1 / 22
220 likes | 338 Vues
This analysis delves into the behavior of rational functions characterized by the form x - a, with a in the range of 1 to 2. It focuses on the intriguing concept of disappearing asymptotes and holes in the graph. The examination encourages you to observe the position of vertical asymptotes and the distance between the two halves of the graph. Additionally, an extension invites exploration of graph behavior from the left side of the asymptote, prompting questions on how such changes alter the overall graph structure.

E N D
Disappearing Asymptotes The Visual Answers
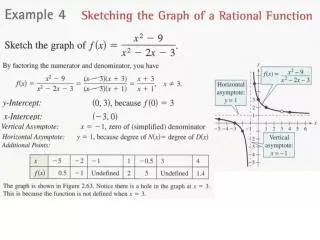
Consider the graph of the function defined by: Disappearing Asymptotes:
hole in the graph! Again:
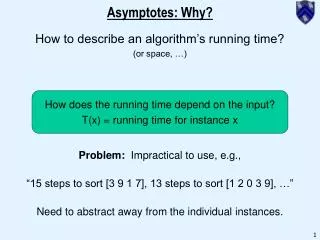
Consider the graph of a series of rational functions with denominator of the form x – a, where 1 < a < 2. Keep your eye on: 1) the position of the vertical asymptote 2) the diagonal distance between the two “halves” of the graph.
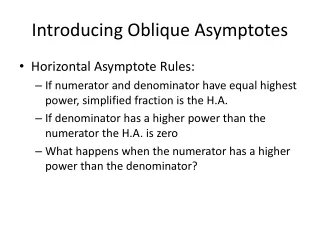
Extension: • What would happen if we explored the same relationship from the left side of the asymptote? i.e. • How would the graph change, etc.?