Download
1 / 33
340 likes | 529 Vues
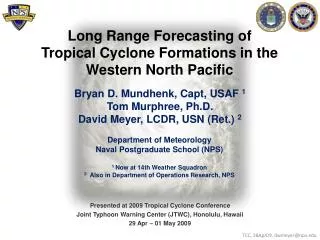
Long Range Atmosphere-Ocean Forecasting in Support of USW Operations in the Western North Pacific. LT Sarah Heidt, USN Naval Postgraduate School 10 SEPTEMBER 2009 Co-Advisors: Prof. Tom Murphree & CDR Rebecca Stone, USN. Overview. Motivation Background Prior Work Data and Methods

E N D
Long Range Atmosphere-Ocean Forecasting in Support of USW Operations in the Western North Pacific LT Sarah Heidt, USN Naval Postgraduate School 10 SEPTEMBER 2009 Co-Advisors: Prof. Tom Murphree & CDR Rebecca Stone, USN UNCLASSIFIED
Overview • Motivation • Background • Prior Work • Data and Methods • Results • Conclusions • Recommendations for Future Work UNCLASSIFIED
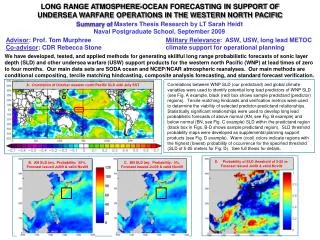
Motivation • A majority of long lead support products for USW planning use LTM based climatology datasets (e.g. GDEM) • Less than optimal temporal resolution • Do not adequately depict intraseasonal and interannual climate variations • Prior work by Turek (2008) highlighted advantages of using advanced reanalysis datasets and methods • Greatly enhanced temporal resolution • Additional variables (e.g., SSH, ocean currents, heat flux) • Conditional climatology capability • Prior studies have shown skill in using advanced LRF methods to produce skillful long range forecasts • LTM products are NOT forecasts – often used as such • GOAL OF THIS STUDY: • Use advanced datasets and methods to develop viable long range climatological forecasts of acoustically relevant variables for planning USW operations in the WNP UNCLASSIFIED
Background How can the Navy improve its long lead support for USW planning? UNCLASSIFIED Slide adapted from Turek (2008) thesis brief, “Smart Climatology Applications for ASW in the WESTPAC.”
Background How can the Navy improve its long lead support for USW planning? Level of METOC Effort vs. Level of Potential Impact on Operations Operational PlanningTeam Engagement MissionPlanning Cell Engagement OPLAN/CONPLAN Development EnvironmentalReconnaissance EnvironmentalReconstruction and Analysis Level of Impact METOC Level of Effort Trade Space Opportunity COCOM Battlespace Prep Survey Program TAS TOS Mission execution briefs OPLAN/CONPLAN Studies Years Months Weeks Days Hours Strategic Operational Tactical From ASW Coordination/CONOPs Conf 14 Mar 05; CAPT Jeff Best, CNMOC Director for ASW; CDR Van Gurley, CNMOC Deputy Director for ASW UNCLASSIFIED
Background How can the Navy improve its long lead support for USW planning? Battle Space on Demand Smart climatology based decision surfaces Smart climatological performance surfaces Smart climatological analyses & forecasts Smart climatology datasets UNCLASSIFIED Modified from Naval Oceanography Brief, CAPT White, April 2009.
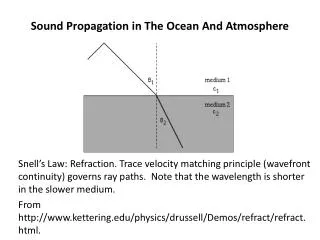
Background Sonic Layer Depth The level of near surface maximum sound speed LTM Sonic Layer Depth (January) Sound Speed Sound Speed Sonic Layer Depth Near Surface Shadow Zone Depth Depth Shadow Zone Range Range Where is the acoustic high ground? UNCLASSIFIED Sound speed images from http://www.fas.org/man/dod-101/navy/docs/
Prior Work Interannual Variability of Sonic Layer Depth GDEM SODA 5 Highest Wind Years 5 Lowest Wind Years UNCLASSIFIED Sonic Layer Depth plots altered from Turek (2008) thesis brief, “Smart Climatology Applications for ASW in the WESTPAC.”
Prior Work October September Global SST Correlated with OctoberMeridional Wind Speed in the ECS August July Region of strong negative correlation between October MerWnd speed and SST UNCLASSIFIED Images created at http://www.cdc.noaa.gov/Correlation/.
Data • Atmospheric and Oceanic reanalysis data from the National Center for Environmental Prediction (NCEP) / National Center for Atmospheric Research (NCAR) • Global restrospective analysis from 1957 to present • Temporal resolution of 6 hours • Spatial resolution of 2.5°x 2.5° and 28 vertical levels • Simple Ocean Data Assimilation (SODA) reanalysis dataset • Global restrospective ocean analysis from 1958 to present • Upper-ocean temp, sal, and currents • Temporal resolution of 5 days • Spatial resolution of .5° x .5° and 40 vertical levels (from 5 to 5374 m) • This study focused on years from 1970 - 2006 • Maximize postive impacts of post 1970 satellite era data • SODA version available up to 2006 • These two reanalysis datasets have the ability to capture low frequency climate variations which are not captured by traditional LTM based climatology datasets (e.g. GDEM) UNCLASSIFIED
Methods • Climate Analysis • Seasonal variability in SLD • Month of interest based on operational and tactical significance • Monthly LTM and standard deviation SLD analysis • Monthly SLD threshold probabilities • Predictand selection • ESRLteleconnection correlations & predictor selection • Identification of potentially predictable long lead relationship between SLD (predictand) and SST (predictor) • Predictor-predictand time series analysis • Tercile matching hindcasts & verification metrics • Deterministic approach for verifying long lead predictability potential of the predictor-predictand pair • Composite Analysis Forecast Method • Probabilistic long-range forecasting method based on the conditional probability of a certain event occurring • Conditional Composite Climatology • Conditional upper and lower tercile composite means • Conditional upper and lower tercile composite threshold probabilities UNCLASSIFIED
Climate Analysis and LRF Methodology Climate Analysis: Seasonal Variability Monthly LTM and STD Threshold probabilities SODA Ocean Reanalysis Dataset Choose Predictand NCEP Reanalysis Data Evaluate Correlations & Teleconnections Choose Predictor • Develop Composite Analysis Forecast • Perform composite analysis • Conduct risk analysis and determine statistical significance • Are CAF results statistically significant (≥ 90 %) Tercile Matching Hindcasts & Verification Is predictor/predictand pair viable? YES Evaluate other potential predictor variables NO Base LRF on LTM and/or conditional means YES Base LRF on CAF Provide tailored long lead forecast support products Conditional Climatology: Upper tercile conditional mean Lower tercile conditional mean Conditional threshold probabilities Supplement CAF with conditional climatology support products UNCLASSIFIED
Seasonal Sonic Layer Depth Long Term Mean JANUARY APRIL JULY OCTOBER *** Note the difference in color bar scales between January and other months*** UNCLASSIFIED
Seasonal Sonic Layer Depth Standard Deviation JANUARY APRIL JULY OCTOBER UNCLASSIFIED
October Sonic Layer Depth Threshold Probabilities ≤ 5m ≥ 5m & ≤ 25m • Probability of SLD threshold occurrence • Based on SODA depth values • 5-25 meters -- associated with periscope operating depths • >25 meters -- associated with deep ocean operations ≥ 70m ≥ 25m & ≤ 45m ≥ 45m & ≤ 70m UNCLASSIFIED
Predictand Selection October LTM Sonic Layer Depth & ECSPredictand Region • Predictand Selection based on: • Operational interests • Tactical interests • Scientific interests ECSpredictand region consisting of 37 years of area averaged monthly SLD values for October UNCLASSIFIED
Teleconnection Correlations & Predictor Selection ECSSLDPredictand Index Correlations with Global SST Oct ECSSLD correlations with October SST Oct ECSSLD correlations with September SST Oct ECSSLD correlations with August SST Oct ECSSLD correlations with July SST Correlations greater then 0.3 are significant at the 95% confidence interval (Wilks 2006) → potential SST predictor UNCLASSIFIED Images created at http://www.cdc.noaa.gov/Correlation/.
Predictand & Predictor Timeseries October ECSPredictand vs. Zero and Three month lead SST Predictors • Verify positive correlations between predictor and predictand • Identify possible trends UNCLASSIFIED
Tercile Matching Hindcasts & Verification Metrics • VERIFICATION METRICS: • Hindcasts and metrics are used to determine the viability of our predictor-predictand relationship • % Corr = ratio of correct hindcasts to all hindcasts • FA Rate = ratio of false alarms to all hindcasts of the event • POD = ratio of hits to the total number of occurrences of the even • HSS = ratio of correct hindcasts to proportion of correct hindcasts that could have been generated using random independent forecasts (i.e. random chance) UNCLASSIFIED
Composite Analysis Results Results outlined in black are statistically significant at the 95% confidence level UNCLASSIFIED
Composite Analysis Forecast Equations NOAA CAF Equations • NOAA equations require a probability of occurrence for the predictor • Our results us an analyzed value of the predictor at a specified lead time • The analyzed value of AN, NN, or BN SST is given a value of 1 otherwise 0 UNCLASSIFIED
Composite Analysis Forecast Equations Modified NOAA CAF Equations 1 0 0 0 0 1 0 0 1 EXAMPLE: SST in our predictor region is AN UNCLASSIFIED
Probablistic Composite Analysis Forecast July 2009 SST ANOMALY AN JULY 2009 SST PREDICTOR ANOMALY UNCLASSIFIED Image created at http://www.cdc.noaa.gov/Correlation/.
Conditional Climatology October Lower TercileSLD October Upper TercileSLD Issued July 2009 Valid October 2009 17% probability that October 2009 SLD will look like this 58% probability that October 2009 SLD will look like this UNCLASSIFIED
Conditional Climatology AN October Sonic Layer Depth Threshold Probabilities ≤ 5m ≥ 5m & ≤ 25m Issued July 2009 Valid October 2009 ≥ 25m & ≤ 45m ≥ 45m & ≤ 70m ≥ 70m UNCLASSIFIED
ANNUALEX 2009 LONG RANGE SUPPORT PRODUCTS November LTM Sonic Layer Depth November STD Sonic Layer Depth • Long lead support was requested for WNP exercise ANNUALEX • Black box indicates approximate ANNUALEXOPAREA • Red box indicates region chosen for SLDpredictand index UNCLASSIFIED
ANNUALEX 2009 LONG RANGE SUPPORT PRODUCTS November Sonic Layer Depth Threshold Probabilities ≤ 5m ≥ 5m & ≤ 25m ≥ 25m & ≤ 45m ≥ 45m & ≤ 70m ≥ 70m & ≤ 110m ≥ 110m UNCLASSIFIED
ANNUALEX 2009 LONG RANGE SUPPORT PRODUCTS July 2009 SST ANOMALY AN JULY 2009 SST PREDICTOR ANOMALY UNCLASSIFIED Image created at http://www.cdc.noaa.gov/Correlation/.
ANNUALEX 2009 LONG RANGE SUPPORT PRODUCTS November Lower TercileSLD November Upper TercileSLD Issued July 2009 Valid November 2009 0% probability that November 2009 SLD will look like this 50% probability that November 2009 SLD will look like this UNCLASSIFIED
ANNUALEX 2009 LONG RANGE SUPPORT PRODUCTS AN November Sonic Layer Depth Threshold Probabilities Issued July 2009Valid October 2009 ≥ 5m & ≤ 25m ≥ 25m & ≤ 45m ≤ 5m ≥ 70m & ≤ 110m ≥ 110m ≥ 45m & ≤ 70m UNCLASSIFIED
Conclusions • Navy LTM based climatology does not capture large-scale climate system variations that are necessary for long range predictability and operational planning • Civilian agencies have developed advanced datasets and methods to analyze and forecast the climate system • The U.S. Navy has adapted and used very little of civilian technology to advance their long range climate prediction capabilities • Viable teleconnections exist between SST predictors in the equatorial and south Pacific & SLD in the WNP • These teleconnections can be used to generate skillful long lead probabilistic forecasts of SLD in the WNP at lead times of 0-4 months • Using advanced climate datasets and methods provide a more complete and accurate forecasts than the current practice of using LTM based products for long range military planning • Better long range planning products have the potential for saving the military time and tax dollars UNCLASSIFIED
Future Work • Provide the long lead planning products developed in this study to USWMETOC support staff and USW planners for experimental use in USW planning • Explore the use of other USW relevant predictands (e.g. BLG, ILG, COF) • Apply advanced data sets and methods used in this study to other tactically significant and strategically important regions in the world • Explore potential predictability of SST from multiple regions as well as other oceanic variables (e.g. subsurface ocean temperature) • Use the results presented in this study to develop tier 2 sonar performance predictions and tier 3 decision recommendation products for USW operations • This research primarily focuses on statistical links between acoustic derived USW variables of interest (SLD) and global climate variables (SST). Future work should focus on developing a deeper understanding the dynamics that cause the teleconnections identified in this study • Conduct verification of the CAF method used to develop long lead probabilistic predictions of WNPSLD (e.g. extensive hindcasts and real forecasts) • Pursue development of a web-based application for SODA UNCLASSIFIED
QUESTIONS?Contact Information:LT Sarah Heidt, Student, NPSslheidt@nps.eduDr. Tom Murphree, Meteorology Co-Advisor, NPSmurphree@nps.eduCDR Rebecca Stone, Oceanography Co-Advisor, NPSrestone@nps.edu UNCLASSIFIED