Download
1 / 1
10 likes | 104 Vues
Thesis research on generating long-range forecasts of undersea warfare support products in the WNP. Methods, data sets, and predictor relationships analyzed to develop probabilistic SLD forecasts.

E N D
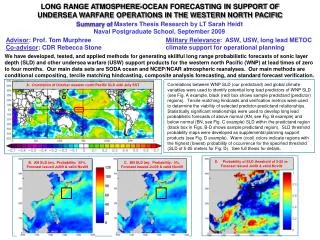
LONG RANGE ATMOSPHERE-OCEAN FORECASTING IN SUPPORT OF UNDERSEA WARFARE OPERATIONS IN THE WESTERN NORTH PACIFIC Summary of Masters Thesis Research by LT Sarah Heidt Naval Postgraduate School, September 2009 Advisor: Prof. Tom Murphree Military Relevance: ASW, USW, long lead METOC Co-advisor: CDR Rebecca Stone climate support for operational planning We have developed, tested, and applied methods for generating skillful long range probabilistic forecasts of sonic layer depth (SLD) and other undersea warfare (USW) support products for the western north Pacific (WNP) at lead times of zero to four months. Our main data sets are SODA ocean and NCEP/NCAR atmospheric reanalyses. Our main methods are conditional compositing, tercile matching hindcasting, composite analysis forecasting, and standard forecast verification. Correlations between WNP SLD (our predictand) and global climate variables were used to identify potential long lead predictors of WNP SLD (see Fig. A example, black (red) box shows sample predictand (predictor) regions). Tercile matching hindcasts and verification metrics were used to determine the viability of selected predictor-predictand relationships. Statistically significant relationships were used to develop long lead probabilistic forecasts of above normal (AN, see Fig. B example) and below normal (BN, see Fig. C example) SLD within the predictand region (black box in Figs. B-D shows sample predictand region). SLD threshold probability maps were developed as supplemental planning support products (see Fig. D example). Warm (cool) colors indicate regions with the highest (lowest) probability of occurrence for the specified threshold (SLD of 5-25 meters for Fig. D). See full thesis for details. A. Correlation of October western north Pacific SLD with July SST C. BN SLD (m). Probability: 0%. Forecast issued Jul09 & valid Nov09 • Probability of SLD threshold of 5-25 m. • Forecast issued Jul09 & valid Nov09 B. AN SLD (m). Probability: 50%. Forecast issued Jul09 & valid Nov09