Correlation and Regression
Correlation and Regression. Analysis of Continuous Independent Variables and Non-experimental Data. Continuous vs Nominal IVs. Nominal IVs are analyzed with t or ANOVA (e.g., trained vs. control) Continuous IVs are analyzed with correlation or regression (e.g., SAT scores predict GPA)


Correlation and Regression
E N D
Presentation Transcript
Correlation and Regression Analysis of Continuous Independent Variables and Non-experimental Data
Continuous vs Nominal IVs • Nominal IVs are analyzed with t or ANOVA (e.g., trained vs. control) • Continuous IVs are analyzed with correlation or regression (e.g., SAT scores predict GPA) • Design. Variable assignment vs. variable measurement implication for inference.
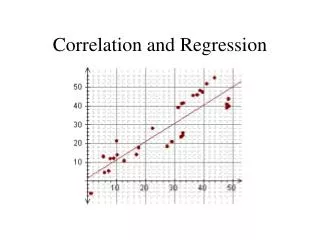
Correlation Coefficient • aka Pearson Product-Moment Correlation Coefficient. • Correlation coefficient summarizes the relations b/t 2 variables, both direction and degree (closeness). Scattergram summary. • Sample r; population (Greek rho). • Can take values from –1 thru 0 to +1. • Sign tells direction (+ or -); magnitude or value tells closeness or degree.
N Ht. In. Wt. Lbs. 1 60 102 2 62 120 3 63 130 4 65 150 5 65 120 6 68 145 7 69 175 8 70 170 9 72 185 Example of a Positive Correlation 10 74 210 Positive Correlation When one variable increases, the other also increases.
N Study Time Minutes # Error 1 90 25 2 100 28 3 130 20 4 150 20 5 180 15 6 200 12 7 220 13 8 300 10 9 350 8 Example of a Negative Correlation 10 400 6 Negative Correlation When one variable increases, the other decreases.
N SAT-V Toe Size 1 450 1.7 2 480 1.8 3 500 1.6 4 510 1.8 5 520 1.9 6 550 1.7 7 600 1.6 8 630 1.7 9 650 1.9 Example of a Zero Correlation (*Strictly speaking, no linear relation.) 10 700 1.7 Zero Correlation No relation*: when one variable increases, the other variable neither increases nor decreases.
Correlation Sign & Magnitude The sign indicates the direction of the relationship. If positive, they increase together. If negative, when one goes up the other goes down. The absolute value tells the strength of the relationship. Values close to +1 and –1 indicate very strong relations. As r 0, the relationship is weaker. If r=0, no relation. If |r|=1, perfect relation.
N Cars sold $ 1 10 1000 2 15 1500 3 20 2000 4 25 2500 5 30 3000 6 35 3500 7 40 4000 8 45 4500 Perfect Positive Correlation (r = 1) Notice the straight line. When r=+1 or -1, all the points will fall on a line.
Example Correlations Correlation + - + 0 + -
Computing the Correlation The definition: The correlation coefficient, r, is the average cross-product of z scores. zX is X in z-score form, zY is Y in z-score form and we multiply the two. We add them all and divide by N to get the average. An alternate formula: In this formula, x and y are deviations from the mean. Recall that .
N Ht Wt Zht Zwt Zh*Zw -1.58 = (60-66.8)/4.31 1 60 102 -1.58 -1.51 2.39 2 62 120 -1.11 -0.95 1.06 3 63 130 -0.88 -0.64 0.57 4 65 150 -0.42 -0.02 0.01 5 65 120 -0.42 -0.95 0.40 6 68 145 0.28 -0.18 -0.05 7 69 175 0.51 0.75 0.39 8 70 170 0.74 0.60 0.45 9 72 185 1.21 1.06 1.29 10 Mean 74 210 1.67 1.84 3.08 66.8 150.7 0 0 0.96 S [N] (SD[N-1]) 4.31 (4.54) 32.20 (33.95) 1 1 -1.51=(102-150.7)/32.2 Computational Example
Properties of r 1. Same scattergram; one raw and one in z. 2. Each pair of scores is a point. Points fall in quadrants created by the means. 3. Cross-products form 2 positive & 2 negative quadrants. 4. r is the average of the cross-products so if most points are in the positive quadrants, r will be positive.
Review • What are the maximum and minimum values of r? • What does r summarize? • What is the symbol for the population value of r? • How does r show direction of relations? • How does r show magnitude of relations?
Regression • Correlation and regression are closely related in use and in math. • Correlation summarizes the relations b/t 2 variables. • Regression is used to predict values of one variable from values of the other (e.g., SAT to predict GPA).
Regression Line (1) Basics 1. Passes thru both means. 2. Passes close to points. Note errors. 3. Described by an equation.
Regression Line (2) Slope Equation for a line is Y=mX+b in algebra. In regression, equation usually written Y=a+bX (Sanocki’s notation is unusual. I’m using standard.) Y is the DV (weight), X is the IV (height), a is the intercept (-327) and b is the slope (7.15). The slope, b, indicates rise over run. It tells how many units of change in Y for a 1 unit change in X. In our example, the slope is a bit over 7, so a change of 1 inch is expected to produce a change a bit more than 7 pounds.
Regression Line (3) Intercept The Y intercept, a, tells where the line crosses the Y axis; it’s the value of Y when X is zero. The intercept is calculated by: Sometimes the intercept has meaning; sometimes not. It depends on the meaning of X=0. In our example, the intercept is –327. This means that if a person were 0 inches tall, we would expect them to weigh –327 lbs. Nonsense. But if X were the number of smiles,then a would have meaning.
Correlation & Regression Correlation & regression are closely related. 1. The correlation coefficient is the slope of the regression line if X and Y are measured as z scores. Interpreted as SDY change with a change of 1 SDX. • For raw scores, the slope is: The slope for raw scores is the correlation times the ratio of 2 standard deviations. (These SDs are computed with (N-1), not N). In our example, the correlation was .96, so the slope can be found by b = .96*(33.95/4.54) = .96*7.45 = 7.15. Recall that . Our intercept is 150.7-7.15*66.8 -327.
Correlation & Regression (2) • The regression equation is used to make predictions. • The formula to do so is just: • Suppose someone is 68 inches tall. Predicted weight is • -327+7.15*68 = 159.2.
Review • What is the slope? What does it tell or mean? • What is the intercept? What does it tell or mean? • How are the slope of the regression line and the correlation coefficient related? • What is the main use of the regression line?
Work an Example • Finger length • Height in Families