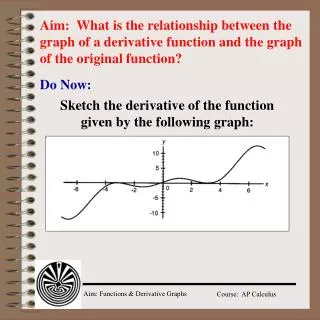
This graph shows the relationship between time and the depth of water in a leaky swimming pool.
This graph shows the relationship between time and the depth of water in a leaky swimming pool. What is the dependent variable? What is the independent variable? a . What is the initial depth of the water ? b.For what time interval(s) is the water level decreasing ?

This graph shows the relationship between time and the depth of water in a leaky swimming pool.
E N D
Presentation Transcript
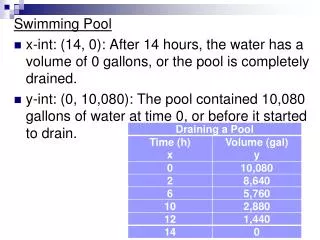
This graph shows the relationship between time and the depth of water in a leaky swimming pool. • What is the dependent variable? • What is the independent variable? • a. What is the initial depth of the water? • b.For what time interval(s) is the water level decreasing? • c.What accounts for the decrease(s)? • d.For what time interval(s) is the water level increasing? • e.What accounts for the increase(s)? • f.Is the pool ever empty? How can you tell? Depth (ft) Time (hrs) 2 feet 2 < x < 6 11 < x < 16 The pool’s leak 6< x < 10 Filling the pool back up with water No because the depth never reaches zero feet.
This graph shows the volume of air in a balloon as it changes over time. • a.What is the independent variable? How is it measured? • b.What is the dependent variable? How is it measured? • c.For what time intervals is the volume increasing? What accounts for the increases? Time, seconds Volume, cubic inches 2 < x < 4 5.5 < x < 8 9 < x < 12
You Try! Given the graph of the distance from a Ranger’s station (in miles) while hiking in the Smokies. • What is the dependent variable in this graph? • Using inequality notation, list the domain, range and when the function is increasing, decreasing, and constant: • Domain • Range • Increasing • Decreasing • Constant • What is the distance at 11 AM? • Approximately how long will it take a hiker to be 8 miles away? Distance from the Rangers’ station in miles 7 x 0 7 x 1 x 12 x 2 x 10 miles from the station 3 hours
Functions that have smooth graphs, with no breaks in the domain or range, are calledcontinuousfunctions. • Functions that are not continuous often involve quantities—such as people, cars, or stories of a building—that are counted or measured in whole numbers. Such functions are called discretefunctions. Below are some examples of discrete functions. Describe each graph as increasing or decreasing at a constant or changing rate & continuous or discrete Increasing @ changing rate, continuous Decreasing @ changing rate, discrete Decreasing @ changing rate, continuous Increasing @ constant rate, continuous Increasing @ constant rate, discrete
Matching-Up InvestigationRead the description of each situation below. Identify the independent and dependent variables. Then decide which of the graphs above match the situation. Time Tiger population Discrete, starting slightly above zero, increasing @ a changing rate Time Tea temperature Continuous, starting far up y-axis, decreasing @ a changing rate
Matching-Up InvestigationRead the description of each situation below. Identify the independent and dependent variables. Then decide which of the graphs above match the situation. Time Number of daylight hours Discrete, starting slightly above zero, increasing @ a changing rate Time Height of a person above ground on ferris wheel Continuous, starting 10 feet on y-axis, increasing until it reaches it’s max, then starts decreasing back towards ground. Never touches x-axis.