Download
1 / 38
380 likes | 459 Vues
This draft presentation compares the measured projection of a wire using the PS laser calibration system with the theoretical projection. Measurements conducted at scan speeds of 10 and 15 m/s for IN and OUT movements. Key parameters and assumptions detailed. Analysis involves minimization strategies using various equipment and methods. Evaluation of mechanical deformations and wire movement impact on projections. Critically assesses assumptions for accuracy. Updated plots with adjusted parameters for enhanced comparison. Includes implications for scanner calibration system.

E N D
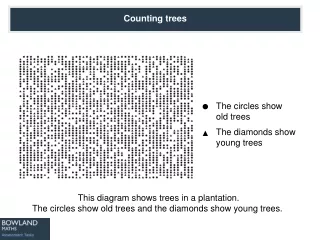
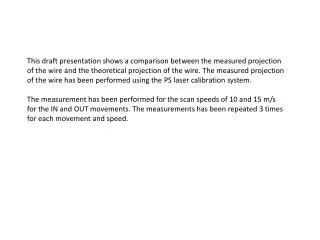
This draft presentation shows a comparison between the measured projection of the wire and the theoretical projection of the wire. The measured projection of the wire has been performed using the PS laser calibration system. The measurement has been performed for the scan speeds of 10 and 15 m/s for the IN and OUT movements. The measurements has been repeated 3 times for each movement and speed.
This study is based in the following assumptions and parameters: • the distance from the fork axis to the beam axis (OBF) is 100,44 mm • the total angle of the fork travel (Th) is 136 degrees • the angle between the fort at IN position and the projection axis (Th0) is 0 • the positive direction of the fork rotation is defined from the IN to the OUT • the distance between the laser and the beam (OL) is 0 • the distance from the axis of the fork to the wire (FL) is 164 mm • the potentiometer value at IN position (potIN) is 41215 bits • the potentiometer value at OUT position potOUT) is 24345 bits • the total angle travelled by the motor is 180 degrees • see next slide for more details
Minimization strategies - Calibration Beam expender Scanner Laser Displacer Displacer Photodiode +/- 50 mm Calibration table diode signal IN OUT Thanks to Jonathan Emery time
Scanner configuration tank wall fork axis OUT Th OFB FL Beam axis (center of the tank) OL Laser axis Th0 IN projection axis
Scanner configuration 250 projection ~ 288.3 mm wire projection (mm) 50 calibration region 100 mm 0 -50 -100 motor position (bits) shows the calibration region location respect to the total projection of the fork travel
Scanner configuration The following plots show the comparison between the wire projected position recorded with the laser calibrations system and the theoretical projection of the wire based in the kinematic chain of the scanner. In principle the differences between both projections are due to the deformations on the mechanical parts of the system and on the carbon wire during the movement.
In order to have a more realistic comparison, most of the parameters used in this analysis have to be verified with the scanner used in the calibration system . For example the assumption that the angle between the fork of the scanner at IN position and the projection plane (Th0) is 0 is maybe not fully right. The following plots are equivalent to the previous plots with the difference that the the value Th0 is set to 3 degrees.
G1 @ 15 m/s 0.25 V ~ 40 um IN Volts Offset between IN and OUT OUT OUT Bits
IN OUT