Download
1 / 1
10 likes | 142 Vues
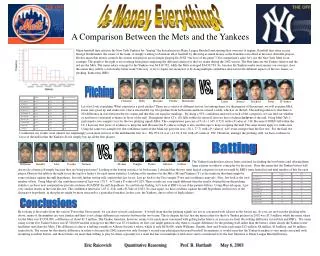
ERA. Total hits. Strike outs. RBIs. Home runs given up. J. Giambi (Y). 176. 122. R. Clemens (Y). 4.35. 192. 18. D. Jeter (Y). 191. 75. D. Wells (Y). 3.75. 137. 21. A. Soriano (Y). 209. 102. M. Mussina (Y). 4.05. 182. 27. J. Posada (Y). 137. 99. A. Pettitte (Y). 3.27.

E N D
ERA Total hits Strike outs RBIs Home runs given up J. Giambi (Y) 176 122 R. Clemens (Y) 4.35 192 18 D. Jeter (Y) 191 75 D. Wells (Y) 3.75 137 21 A. Soriano (Y) 209 102 M. Mussina (Y) 4.05 182 27 J. Posada (Y) 137 99 A. Pettitte (Y) 3.27 97 6 B. Williams (Y) 204 102 O. Hernandez (Y) 3.64 113 17 M. Vaughn (M) 126 72 A. Leiter (M) 3.48 172 23 R. Cedono (M) 133 41 P. Astacio (M) 4.79 152 32 M. Piazza (M) 134 98 S. Trachsel (M) 3.37 105 16 R. Alomar (M) 157 53 S. Estes (M) 4.55 92 12 E. Alfonzo (M) 151 56 J. D’Amico 4.94 101 20 Is Money Everything? A Comparison Between the Mets and the Yankees Many baseball fans criticize the New York Yankees for “buying” the best players in Major League Baseball and starting their own sort of regime. Baseball fans often accuse George Steinbrenner, the owner of the team, of simply wanting to dominate all of baseball by throwing as much money as the franchise can afford at the most desirable players. Do this mean that money controls the system and players are no longer playing for JUST “the love of the game”? For comparison’s sake, let’s use the New York Mets as an example. The graph to the right is an overlying histogram comparing the different salaries for the two teams during the 2002 season. The blue lines are the Yankee salaries and the red are the Mets. The mean salary average for the Yankees was $4,818,792, while the Mets averaged $3,639,754. So, because the Yankees make more money (on average), does this mean they will be a statistically better team? One way to try to figure out an answer is by doing multiple confidence intervals in the different aspects of the two teams, i.e. pitching, home runs, RBIs. VS. Pitching Clemens Wells Mussina Pettitte Hernandez Leiter Astacio Trachsel Estes D’Amico Lets first look at pitching. What constitutes a good pitcher? There are a variety of different factors, but among them, for the purpose of this project, we will examine ERA, home runs given up and strike outs. I have selected the top five pitchers from both teams and have created a table, which is on the left. The null hypothesis is that there is NO difference in stats between the two teams and that they are equal in standings. By doing a 95% confidence interval for each of the categories, we can find out whether or not there is statistical evidence in favor of the null. Throughout these CI’s, if 0 falls within the interval, then we have evidence in favor of the null. Using Mini-Tab, I performed a two-sample t-test for the two pitching squads ERA. The computations gave me a CI of (-1.345, 0.517) with a P-value of .318. Because 0 DOES fall within the CI, I have my first piece of evidence to keep the null. Because the P-value is so high is also another sign to keep accepting the null. The same results apply for strike-outs. Using the same two-sample test, the confidence interval that Mini-tab gave me was (-38.1, 77.7) with a P-value of .445, even stronger than the first test. For the final test I conducted, my results were (almost not surprisingly) even more in favor of the null than the first two. My 95% CI was (-14.22, 8.62) with a P-value of .580. Therefore, amongst the pitching staff, we have evidence in favor of the null in that the Yankees do not simply buy up all the best players. Batting VS. The Yankee franchise has always been criticized for finding the best batters and offering them large salaries in order to come play for the team. Does this mean that the Yankee batters will Williams Giambi Jeter Posada Soriano Alomar Vaughn Piazza Alfonzo Cedeno always do a better job simply because they are being paid more? Looking at the batting statistics for both teams, I decided that the two most logical categories to test on would be RBI’s (runs batted in) and total number of hits for each player. Observe the table to the right to see the top five batter’s for each teams statistics. Looking at the numbers for the Mets (M) and Yankees (Y) at first indicate that there might be some evidence against the null hypothesis, but only further testing will confirm this fact for us. Lets go back to the Two-sample T-test and confidence intervals. First, lets look at the total number of hits. Using Mini-tab, the confidence interval I got was (-79.7, -6.7) and a P-value of 0.029. These results are very much different than the results obtained from the pitching statistics, as these new computations provide evidence AGAINST the null hypothesis. To confirm our finding, let’s look at RBI’s to see if the pattern follows. Using Mini-tab again, I got very similar results as the total hits test. The confidence interval is (-65.2, -6.8) with a P-Vale of 0.023. So once again, we have evidence against the null hypothesis and in favor of the alternative hypothesis, in that players might be more attracted to a particular franchise, in this case, the Yankees, due to offers of high salaries. Conclusions By looking at the results from the various T-tests that I have made, we can draw several conclusions. It would seem that the pitching squads are not as concerned with salaries as the batters are. As you can see from the pitching table above, many of the numbers are very similar and there is not a huge difference in statistics between the two teams. This is despite the fact that the mean salary for the five Yankee pitchers in 2002 was $7.5 million, while the mean salary for the Mets was $5,958,000, a difference of about $1.5 million. The Yankee franchise, however, seems to be much more concerned with getting better hitters, as you can see from the striking difference in total hits and RBI’s. The mean salary for the five Yankee batters was $7,526,000 and the average for the Mets was $7.12 million. At first, one might question why there is a larger difference for the pitching staff rather than the batters, when clearly the Yankee roster had better stats than the Mets. This difference is due to a lurking variable in Alfonso Soriano’s salary, which is only $630,000, while Williams, Giambi, Jeter and Posada each make $12 million, $8 million, $13million, and $4 million, respectively. The reason for this drastic difference in salary is because the 2002 season was only Soriano’s second year playing professional baseball. In summary, it would seem that the Yankee franchise is very much concerned with recruiting excellent batters, and those batters are more than willing to play for them, especially for a team that has won multiple world series’ and is considered to be the best franchise is Major League Baseball history. Eric Raicovich Quantitative Reasoning Prof. B. Hartlaub May 6, 2003