The comparison between 2010 and 2011
2011 PUNTA CANA INTERNATIONAL TOURIST SURVEY University of South Carolina International Tourism Research Institute. Airport Background. Data Collection. General Survey Focus . Overall Airport Evaluation. The comparison between 2010 and 2011. Built in 1984.

The comparison between 2010 and 2011
E N D
Presentation Transcript
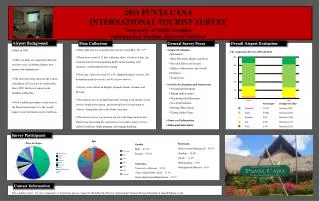
2011 PUNTA CANA INTERNATIONAL TOURIST SURVEY University of South Carolina International Tourism Research Institute Airport Background Data Collection General Survey Focus Overall Airport Evaluation The comparison between 2010 and 2011 • Built in 1984. • There are plans for expansion within the next few years, including adding a new runway and terminal gate. • The fastest growing airport in the country with almost 20% increase in yearly traffic. Since 2009, the busiest airport in the Dominican Republic. • Over a million passengers yearly land at the Punta Cana Airport, it is the second largest tourist destination in the Caribbean. • Data collection was performed for four days from May 14th- 17th • There were a total of 12 data collection shifts. On these 4 days, the research team observed departing flights in the morning, early afternoon, and through the late evening. • The team collected a total of 1,149 completed general surveys, 204 destination analysis surveys, and 41 aircrew surveys. • Surveys were offered in English, Spanish, French, German, and Russian. • The general surveys included questions relating to the quality of and services found in the airport, and about the level of enjoyment of visitors’ during their stay in the Punta Cana area. • The aircrew survey was given to aircrews that bring travelers into Punta Cana, measuring the satisfaction of air traffic control services, airfield conditions, flight planning, and baggage handling. • Airport Evaluation • Restaurants • Duty Free Items Quality and Prices • Personal Safety and Security • Quality of Restrooms and Overall Cleanliness • Temperature • Activity Participation and Satisfaction • Swimming/Sunbathing • Dining in Restaurants • Purchasing Gifts/Souvenirs • Live Entertainment • Boating /Water Sports • Taking Guided Tours • Sources of Information • Influential Individuals Survey Participants • Profession • Professional /Managerial – 56.5% • Student – 12.4% • Trade – 11.1% • Entrepreneur – 10% • Unemployed /Retired – 10% Gender Male – 47.1% Female – 52.9% Education University or Beyond – 55.5% Some college/Trade school – 31.4% Below High School/High School – 12.9% Contact Information For a similar survey for your community or destination, please contact Dr. Rich Harrill, Director, International Tourism Research Institute at rharrill@hrsm.sc.edu.