Understanding Demand: Utility, Preferences, and Consumption Choices
Chapter 20 delves into the determinants of demand and the motivations behind consumer purchase decisions. It explores sociopsychiatric explanations, including Freud's theories on consumption linked to basic drives, and how sociologists view consumption as a reflection of identity and social acceptance. The economic perspective emphasizes the role of price and income in purchasing behavior. Key concepts include total and marginal utility, the law of diminishing marginal utility, and the utility-maximizing rule, guiding consumers to optimize their spending and satisfaction with limited resources.


Understanding Demand: Utility, Preferences, and Consumption Choices
E N D
Presentation Transcript
Chapter 20 Utility
Determinants of Demand • What leads us to buy some goods while rejecting others? Chapter 20 2
The Sociopsychiatric Explanation • In Freud’s view, we strive for higher levels of consumption to satisfy basic drives for security, sex, and ego gratification. • According to some sociologists, people consume more as expressions of identity that provoke recognition or social acceptance. • Not all consumption is motivated by ego or status concerns - There are always basic needs (food, clothes, shelter). Chapter 20 3
The Economic Explanation • Sociopsychiatric theories tell us whywe desire certain goods -- not whatgoods will actually be purchased. • Prices and income are just as relevant to consumption decisions as are more basic desires and preferences. Chapter 20 4
Demand • The willingness and ability to buy specific quantities of a good at alternative prices in a given time period, ceteris paribus. Chapter 20 5
Individual Demand • An individual’s demand for a product is determined by: • Tastes — desire for this and other goods. • Income — of the consumer. • Expectations — for income, prices, tastes. • Othergoods — their availability and prices. Chapter 20 6
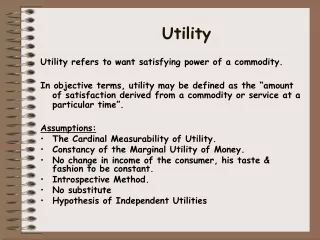
Utility • Utilityis the pleasure or satisfaction obtained from a good or service. • The more pleasure a product gives us, the higher the price we’re willing to pay for it. Chapter 20 7
Total vs. Marginal Utility • Total utilityis the amount of satisfaction obtained from entire consumption of a product. • Marginal utilityis the change in total utility obtained by consuming one additional (marginal) unit of a good or service. Chapter 20 8
Marginal Utility Marginal Utility = change in Total Utility change in Quantity Chapter 20 9
Marginal Utility 20 32 35 35 31 1 Chapter 20 10
Diminishing Marginal Utility • According to the law of diminishing marginal utility, the marginal utility of a good declines as more of it is consumed in a given time period. Chapter 20 11
Diminishing Marginal Utility • As long as marginal utility is positive, total utility must be increasing. • According to the law of diminishing utility, each successive unit of a good consumed yields less additional utility. Chapter 20 12
Price and Quantity • Tastes, through marginal utility, tells us how much we desire particular goods. • Pricetell us how much of a good we will buy. Chapter 20 13
Utility 25 45 57 62 62 42 Chapter 20 14
Utility 35 65 85 100 110 110 Chapter 20 15
Marginal Utility • The more marginal utility a product delivers, the more a consumer is willing to pay. • This is due to diminishing marginal utility –people are willing to buy additional quantities of a good only if its price falls. • As the marginal utility of a good diminishes, so does our willingness to pay. Chapter 20 16
Marginal Utility vs. Price • Rational behavior requires one to compare the anticipated utility of each item with its cost. • To maximize utility, the consumer should choose that good which delivers the most marginal utility per dollar. Chapter 20 17
Utility Maximization • Optimal consumptionis the mix of consumer purchases that maximizes the utility attainable from available income. • To maximize total utility, consumers choose the optimal consumption combination. Chapter 20 18
Utility Maximizing Rule • The basic approach to utility maximization is to purchase that good next which delivers the mostmarginal utility per dollar. • If a person could get more utility per dollar by buying good X, then she should continue to buy good X. • If a person could get more utility per dollar by buying good Y, then she should continue to buy good Y. Chapter 20 19
Utility Chapter 20 20
How Much to buy • If money wasn’t important: • Buy 4 sodas and 5 pizzas. • Getting the 5th soda gives no extra enjoyment, so why drink it? • The same for a 6th slice of pizza. Chapter 20 21
If you had limited money… • Let’s assume the price of sodas are $1 each, and Pizza is $1 per slice. • If you only had $6, you could get: • 0 sodas and 6 pizzas • 1 soda and 5 pizzas • 2 sodas and 4 pizzas • 3 sodas and 3 pizzas • 4 sodas and 2 pizzas • 5 sodas and 1 pizza • 6 sodas and 0 pizzas Chapter 20 22
If you had limited money… • How many “utils” would each combination get you?: • 0 sodas and 6 pizzas = 110 • 1 soda and 5 pizzas = 135 • 2 sodas and 4 pizzas = 145 This combination gets you the most • 3 sodas and 3 pizzas = 142 • 4 sodas and 2 pizzas = 127 • 5 sodas and 1 pizza = 97 • 6 sodas and 0 pizzas = 42 • No combination will get you more “happiness” for your $6. Chapter 20 23
The Easy Way to Find the Optimal Combination “Spend” your $6 one at a time, then see what you “bought” The 3rd dollar The first dollar The 4th or 5th dollar The 2nd dollar The 5th or 4th dollar The 6th dollar Chapter 20 24
The Indifference Curve • A graph showing the different combinations of 2 goods that will bring you the same level of satisfaction. Chapter 20 25
The Indifference Curve 100 “Utles” 100 “utles” 50 “utles” Chapter 20 26
The Budget Line • A graph showing the different combinations of 2 goods that you can buy for the same amount of money. Chapter 20 27
The Budget Line $6 $4 Chapter 20 28
How Many of Each Should I Buy? • The combination that will get me the most “bang” for my buck. • The most Utility • Where the Indifference Curve & My Budget Line meet. Chapter 20 29
The Indifference Curve 150 “Utles” 100 “utles” 50 “utles” Chapter 20 30
Increased Incomes • As our incomes go up, it allows us to move to a higher indifference curve • We can buy more! Chapter 20 31
Shifts in Demand • When our demand changes, the shape of our indifference curve changes. This changes the combinations of products we choose to buy. Chapter 20 32
The Indifference Curve 150 “Utles” Chapter 20 33