Download
1 / 29
290 likes | 314 Vues
This resource delves into the analysis of social networks on the internet, emphasizing the importance of networks in today's digital world. It covers topics such as network types, data capturing methods, software applications, common metrics like centrality, sub-groups, community detection, and best practices for visualizing data. The text provides insights on the interconnected nature of online platforms, including social networking sites, forums, and blogs. It also discusses how to predict trends in online news through network analysis.

E N D
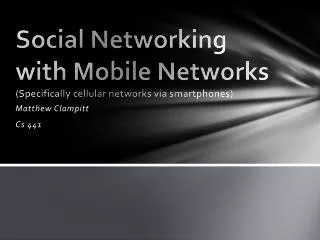
Analysing Social Networks Via the Internet Bernie Hogan PhD Candidate, Department of Sociology Research Coordinator, NetLab
“As we may think” • Wholly new forms of encyclopedias will appear, ready made with a mesh of associative trails running through them… • Vannevar Bush, 1945
60 years later… • We have no shortage of associative trails. But it is not confined to information… • “When computer networks link people as well as machines, they become social networks” (Wellman, et al. 1996)
Why do networks matter? • Google’s succeeded through a social network algorithm. • MySpace and Facebook are the largest explicit social networks ever created. • We can show how the rich get richer “Preferential attachment” (Barabasi and Albert 1998), • And how everyone is only ‘six degrees’, apart (Milgram 1967; Watts 2001).
The Oracle of Kevin Bacon: The Original Online Network The Importance of Being Earnest Where the Truth Lies 84 Charing Cross Road A Few Good Men Mission: Impossible II
What are networks? Relationships between “actors”: • Friendships • Partnerships • Hyperlinks Information about “actors”: • People • Businesses • Webpages Plus
Nodes • Generally constrained to well defined types. • People to people (not to orgs and teams). • More than one type are included in ‘affiliation networks’ • Linking people as one set to events as another set.
Links can be: • Directed links [arcs] (from me to you) • Undirected links [edges] (me and you) • Valued (I sent 3 messages to you) • Signed (I like him & I dislike her) • Multiplex (l link to her blog, know her email and on her MySpace page)
Some Network Types Users of a web forum Subset of political blogs Friend pages on MySpace
Where to find networks online? Social networking Email Social news Web links Blogs Message boards Games Instant messengers
Networks as data To A B From C D
Capturing this data online • Scraping pages • Using scripting languages (python, perl) • Using scraping software • APIs (Application Program Interface) • Again using scripting languages • Out-of-the-box software • Online applications • More on this tomorrow!!
Analysing Data • Software Applications • UCInet: powerful, social-science oriented, quirky interface • Pajek: powerful, strange interface, comprehensive • Others (Egotistics, NetMiner, Visualyzer, NetWorkBench) • Software Environments • JUNG (Java Universal Network Graphing Package) • R (SNA package) • iGraph (Python)
Common metrics I: Centrality • Who is the most connected? • Simple question, complex answer Degree: Number of links 3 Betweenness: Shortest paths PageRank: Links to high degree
Common metrics II: Sub-groups • Interested in group structure • Again, many applicable measures • Components • Number of disconnected sets • Strong: must be an arc in to all nodes • Community detection • See Mark Newman’s work (such as the Girvan-Newman algorithm) • Special K’s: K-shell, K-core, K-plex
World Wide Web: K-shells • http://xavier.informatics.indiana.edu/lanet-vi
Community Detection: Political Blogs • Adamic & Glance. 2004. The Political Blogosphere and the 2004 U.S. Election: Divided They Blog.
Visualizing Data • Applications • GUESS: great for tweaking based on attribute data. Technical, but powerful. • NetDraw: straightforward, integrates with UCInet • Pajek: fast, draws large networks, pretty • More coming out every week (See the work of Martin Wattenberg, Danyel Fisher and Fernanda Viegas) • Environments / Packages • JUNG, Prefuse, Piccolo, R (gplot)
Visualization Best Practices Most Important: Be Graph Literate. Otherwise you’ll be impressed with the first thing you draw, regardless of its quality • General: • Do NOT show a graph for graph’s sake. • Huge networks often give cluttered pictures • ‘De-clutter’ by trimming to symmetric ties. • Drawing Nodes: • Size can often represent log(continuous variable). • Tint - can represent categorical or continuous variable. • Do not show ego in an egonet. • Only use labels on small graphs (n < 50). • Layout • Spring-embedder layouts work nicely. • Post-layout touch ups are possible using ‘bin packing’ (in GUESS).
Example - Digg.com Popular Stories Stories from Friends Today’s Top Stories
Digg: Using networksto Predict the News • Data gathered in early March • All Digg Users with 7 or more top stories (subset of top 1000 Diggers) as of Feb 27 • Mapped symmetric ties • Node size is log(# stories-6), brightness is degree. • Calculated number of ties (for links to top diggers & links to other diggers): • In to node: # Fans • Symmetric: # Friends • Out from nodes: # Watched
Regression Output - Predicting # Popular Stories Effect of fans in high places Very strong models
Online networks in Context Media Multiplexity: There is a positive relationship between the number of ways in which people connect and tie strength (Haythornthwaite 1999)
Networks in a pinch • The number of ties is often the most significant. • Just ask. • Specify boundary conditions (e.g. people you have emailed in the past month) • Categories are help them remember and give you extra data points. (e.g. friends / workmates / relatives) • With a roster, you can get people to select from a list.
Summary • Network analysis: Because sociology wasn’t nerdy enough already. • Involves a disparate suite of programs for capture, analysis and visualization. • Compelling visual imagery - maps of relationships. • Strong explanatory power in online spaces. • A host of meaningful metrics to choose from • Sometimes, the number of ties is enough.
Many Thanks Bernie Hogan bernie.hogan@utoronto.ca PhD Candidate, Department of Sociology Research Coordinator, NetLab Graduate Fellow, Knowledge Media Design Institute University of Toronto P.S. Ask me about my scripts and tools