Principal Components: A Conceptual Introduction
280 likes | 303 Vues
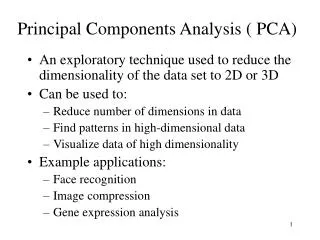
Learn how to objectively measure a soccer team's quality using quantifiable metrics over multiple seasons, including a general metric combining key indicators. Understand correlations between metrics for effective analysis.

Principal Components: A Conceptual Introduction
E N D
Presentation Transcript
Principal Components:A Conceptual Introduction Simon Mason International Research Institute for Climate Prediction The Earth Institute of Columbia University L i n k i n g S c i e n c e t o S o c i e t y
What makes a good soccer team? Everybody(?) has their favourite soccer team. But which is the best team, and how can we determine that it is the best? We usually justify our choice of best team by describing it in rather vague ways such as “good at scoring goals”, “excellent defensive line”, “fair players”. We need some quantifiable metrics rather than vague descriptions. L i n k i n g S c i e n c e t o S p o r t !
Soccer-Playing Metrics Metrics can be defined for measuring the quality of a soccer team objectively. Each metric could be measured over a season or a number of seasons. L i n k i n g S c i e n c e t o S p o r t !
Soccer-Playing Metrics • Frequency of home wins (home wins). • Frequency of home losses (home losses). • Frequency of home goals scored (home for). • Frequency of home goals ceded (home against). • Frequency of away wins (away wins). • Frequency of away losses (away losses). • Frequency of away goals scored (away for). • Frequency of away goals ceded (away against). • Number of bookings (bookings). • Average attendance (attendance). L i n k i n g S c i e n c e t o S p o r t !
English Premiership Teams 2003/04 • Arsenal • Aston Villa • Birmingham • Blackburn Rovers • Bolton Wanderers • Charlton Athletic • Chelsea • Everton • Fulham • Leeds United • Leicester City • Liverpool • Manchester City • Manchester United • Middlesbrough • Newcastle United • Portsmouth • Southampton • Tottenham Hotspur • Wolverhampton Wanderers L i n k i n g S c i e n c e t o S p o r t !
The Premiership Metric In the Premiership the teams are ranked according to the number of games they win and draw, and then by goal difference if there are ties. where I.e., a weighted sum of the metrics is used to rank the teams. L i n k i n g S c i e n c e t o S p o r t !
A General Metric A good team should score highly on all the metrics (note that losses, against and bookings can be measured so that high scores indicate good play by multiplying these scores by -1). If we can combine the original metrics into one new metric that captures as much of the information in the ten metrics as possible, we will have a new general metric that we can use as an overall measure of the quality of a soccer team. L i n k i n g S c i e n c e t o S p o r t !
Variance The differences between the teams on the various metrics provides the information we can use to distinguish good from bad teams. On some metrics (e.g., attendance) the differences are large, but on others (e.g., home losses) most teams score about the same. The variance of each metric tells us the total amount of information we have to distinguish the teams. The total information available to distinguish the teams is the sum of the variances of each metric. L i n k i n g S c i e n c e t o S p o r t !
Since virtually all of the total variance is contributed by attendance, teams need to perform well on this metric. Alternatively, the metrics could be standardized to give them equal weight. L i n k i n g S c i e n c e t o S p o r t !
Standardize? If we want to give each metric the same weight we should standardize the data first otherwise a team which performs poorly on a metric with high variance is likely to score badly overall – it will be difficult to make up the large deficit from metrics on which teams tend to score similarly. The variance of the standardized metrics is 1.0. Therefore the total standardized variance will be 10.0 (the number of metrics). L i n k i n g S c i e n c e t o S p o r t !
The Average The simplest combined score is to average the scores (or standardized scores) on each metric. But information is lost: the variance of the average scores is only about 0.59, compared to the total variance of 10.0). L i n k i n g S c i e n c e t o S p o r t !
The Average • Also, the simple average is not very informative: if we ask why a team is good, the only way to answer is to refer to all ten metrics, which is inefficient for two reasons: • there are too many metrics to which to refer; • some of the metrics are very similar, so if we know that a team scored well on one metric we can assume that it probably scored well on a similar metric … L i n k i n g S c i e n c e t o S p o r t !
Correlations Between the Metrics Some of the metrics seem to measure similar characteristics. For example, home for and away for both relate to the team’s goal-scoring achievements. Correlations between the metrics can be used to tell us whether the metrics are measuring similar aspects of the quality of a soccer team. L i n k i n g S c i e n c e t o S p o r t !
Correlations Between the Metrics Sum of diagonals = 10. L i n k i n g S c i e n c e t o S p o r t !
Independent Metrics Positive correlations between the metrics show that they are measuring similar aspects of the quality of a soccer team. We would like to combine the metrics somehow so that common aspects are measured on a single metric, and each combination measures a different aspect of the quality of a soccer team (i.e., the correlations between these new metrics is zero). The single metric must have high variance so that teams can be distinguished effectively. L i n k i n g S c i e n c e t o S p o r t !
Independent Metrics Objectives: New metrics that meet these objectives are called principal components. • the new metrics are uncorrelated; • each metric in turn summarizes as much information as possible (its variance is maximized); • there is no loss of information. L i n k i n g S c i e n c e t o S p o r t !
Principal Components Principal components are weighted sums of the original metrics. Weighted sums are like weighted averages, except that the weights do not have to add up to 1.0. Instead, with principal components the squares of the weights add up to 1.01. The weights are known as eigenvectors, and are frequently referred to as loadings. The weighted sums are the scores on the new metrics. The new metrics are called principal components. 1 A few authors draw the following distinction: for EOFs the sum of the squared weights is 1; for principal components the sum is equal to the length of the eigenvalue. L i n k i n g S c i e n c e t o S p o r t !
Covariances Between the Principal Components Sum of diagonals = 10 L i n k i n g S c i e n c e t o S p o r t !
Eigenvalues The variances of the principal components are called eigenvalues. The total variance explained by all the principal components is the same as that of the original standardized metrics, and so no information is lost. But most of the total variance is explained by only a few components. Compare the variance of the average of the standardized score (0.59). Principal components with variances > 1.0 have more information than any of the original standardized metrics. L i n k i n g S c i e n c e t o S p o r t !
Soccer Team Principal Component 1 L i n k i n g S c i e n c e t o S p o r t !
Soccer Team Principal Component 1 We can obtain a score for a team by calculating the weighted average of its scores on the 10 original metrics: We can get a score for each team … L i n k i n g S c i e n c e t o S p o r t !
Soccer Team Principal Component 1 L i n k i n g S c i e n c e t o S p o r t !
Soccer-Player Principal Component 1 The score tells us whether the team out-performs their opponents, while playing fairly, and drawing large crowds. L i n k i n g S c i e n c e t o S p o r t !
Soccer-Player Principal Component 2 L i n k i n g S c i e n c e t o S p o r t !
Soccer-Player Principal Component 2 The score tells us whether the team plays better at home or away. L i n k i n g S c i e n c e t o S p o r t !