Download
1 / 7
80 likes | 112 Vues
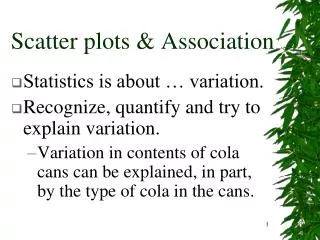
Scatter Plots and Association. How can you construct and interpret scatter plots?. 14.1. ADDITIONAL EXAMPLE 1. Juan recorded the shoe size and the math test scores of several students. The scatter plot shows what he recorded. Describe the association between test score and shoe size.

E N D
Scatter Plots and Association How can you construct and interpret scatter plots? 14.1
ADDITIONAL EXAMPLE 1 Juan recorded the shoe size and the math test scores of several students. The scatter plot shows what he recorded. Describe the association between test score and shoe size. no association
14.1 LESSON QUIZ Use the table for Exercises 1–2. 8.11.A 1. Make a scatter plot of the data.
Use the table for Exercises 1–2. 2. Describe the type(s) of association you see between the height and the weight. Explain. Positive and linear; as the height increases, so does the weight.
For Exercises 3 and 4, use the scatter plot for annual movie attendance by age. 3. Describe any clusters you see in the scatter plot. There are clusters around the age of 6 and also around the age of 18.
For Exercises 3 and 4, use the scatter plot for annual movie attendance by age. 4. Describe any outliers you see in the scatter plot. There are outliers at (24, 9), and (12, 12).
How can you construct and interpret scatter plots? Sample answer: Plot bivariate data on a coordinate plane, with one variable represented by each axis. Look for positive or negative association, clusters, and outliers to interpret the data.