Download
1 / 28
280 likes | 298 Vues
This study explores a data mining framework to characterize and analyze traffic flows in the complex airspace of the New York Metroplex, aiming to identify key factors impacting operational performance, assess system capacity, and model current operations for simulation of new concepts.

E N D
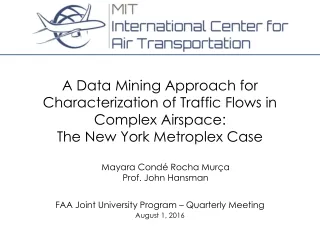
A Data Mining Approach for Characterization of Traffic Flows in Complex Airspace: The New York Metroplex Case FAA Joint University Program – Quarterly Meeting August 1, 2016 Mayara Condé Rocha Murça Prof. John Hansman
Motivation • Metroplex are critical nodes in the National Airspace System (NAS) • High traffic levels associated with large metropolitan regions • Complex airspace design resulting from procedures at airports closely located and need for deconfliction • Volume and airspace complexity result in TFM challenges and can lead to inefficiencies • Planning and execution of arrival and departure rates for metroplex airports is a challenge as terminal airspace is highly constrained and resources are shared • The parameters and conditions that drive metroplex operational complexity and capacity are not well understood
Research Objective • To develop a data mining framework for characterization of traffic flows in metroplex systems at spatial and temporal scales in order to: • Identify key factors that impact metroplex operational performance • Assess system capacity from observed performance • Identify airspace interactions that prevent airport capacity from being used at full extent • Model current operations for simulation of new operational concepts Focus: New York Metroplex Terminal Airspace
The New York Metroplex • Most complex airspace in the NAS • Three major commercial airports • Newark International (EWR) • John F. Kennedy International (JFK) • LaGuardia (LGA) • Very dense routes with small separation • Must be run in a coordinated way LGA 14 nm EWR 9 nm JFK 18 nm
The New York MetroplexTraffic Characteristics Departure push Arrival push Balanced Data Source: ASPM 2013-2015
The New York MetroplexInfrastructure JFK EWR LGA
Data Mining Framework FILTERED AND RESAMPLED FLIGHT TRACKS RAW DATA: OBSERVED FLIGHT TRACKS (ETMS) FOR 69 DAYS 60 nm F1 = (x11, y11, x12, y12,…, x1n, y1n) F2 = (x21, y21, x22, y22,…, x2n, y2n) . . . Fm = (xm1, ym1, xm2 ym2,…, xmn, ymn) TRAINING DATA: 14 days TEST DATA: 55 days CLUSTERING AT SPATIAL SCALE -DBSCAN- CLASSIFICATION -RANDOM FORESTS- CLUSTERING AT TEMPORAL SCALE -HIERARCHICAL CLUSTERING- AIRSPACE STRUCTURE RESOURCE USE MATRIX/VECTOR RESOURCE USE PATTERNS CLUSTER TIME
Data Mining FrameworkClustering at Spatial Scale • Density-Based Spatial Clustering of Applications with Noise – DBSCAN (Ester et al., 1996) • Concept: a cluster is a set of density-connected points • Two input parameters: • MinPts: Minimum number of points (to create a cluster) • Epsilon: Distance threshold
Data Mining FrameworkClustering at Spatial Scale • Density-Based Spatial Clustering of Applications with Noise – DBSCAN (Ester et al., 1996) • Concept: a cluster is a set of density-connected points • Two input parameters: • MinPts: Minimum number of points (to create a cluster) • Epsilon: Distance threshold FUNDAMENTAL CONCEPTS
Data Mining FrameworkClustering at Spatial Scale • Density-Based Spatial Clustering of Applications with Noise – DBSCAN (Ester et al., 1996) • Concept: a cluster is a set of density-connected points • Two input parameters: • MinPts: Minimum number of points (to create a cluster) • Epsilon: Distance threshold FUNDAMENTAL CONCEPTS Epsilon – neighborhood (of a point) Contains all neighboring points that are within a distance Epsilon
Data Mining FrameworkClustering at Spatial Scale • Density-Based Spatial Clustering of Applications with Noise – DBSCAN (Ester et al., 1996) • Concept: a cluster is a set of density-connected points • Two input parameters: • MinPts: Minimum number of points (to create a cluster) • Epsilon: Distance threshold FUNDAMENTAL CONCEPTS Epsilon – neighborhood (of a point) Contains all neighboring points that are within a distance Epsilon Density-reachability A point x is (directly) density-reachable from a core point y if x belongs to the Epsilon-neighborhood of y
Data Mining FrameworkClustering at Spatial Scale • Density-Based Spatial Clustering of Applications with Noise – DBSCAN (Ester et al., 1996) • Concept: a cluster is a set of density-connected points • Two input parameters: • MinPts: Minimum number of points (to create a cluster) • Epsilon: Distance threshold FUNDAMENTAL CONCEPTS Epsilon – neighborhood (of a point) Contains all neighboring points that are within a distance Epsilon Density-reachability A point x can be (indirectly) density-reachable from a core point y through a chain of points
Data Mining FrameworkClustering at Spatial Scale • Density-Based Spatial Clustering of Applications with Noise – DBSCAN (Ester et al., 1996) • Concept: a cluster is a set of density-connected points • Two input parameters: • MinPts: Minimum number of points (to create a cluster) • Epsilon: Distance threshold FUNDAMENTAL CONCEPTS Epsilon – neighborhood (of a point) Contains all neighboring points that are within a distance Epsilon Density-reachability A point x can be (indirectly) density-reachable from a core point y through a chain of points Density-connectivity Two points are density-connected if there is a third point from which they are density-reachable
Data Mining FrameworkClustering at Spatial Scale • Density-Based Spatial Clustering of Applications with Noise – DBSCAN (Ester et al., 1996) • Concept: a cluster is a set of density-connected points • Two input parameters: • MinPts: Minimum number of points (to create a cluster) • Epsilon: Distance threshold FUNDAMENTAL CONCEPTS Epsilon – neighborhood (of a point) Cluster 2 Cluster 1 Contains all neighboring points that are within a distance Epsilon Density-reachability A point x can be (indirectly) density-reachable from a core point y through a chain of points Density-connectivity Noise Two points are density-connected if there is a third point from which they are density-reachable
Airspace StructureJFK Arrivals JFK Arrivals Northeast West 21 clusters South North
Airspace StructureNY Arrivals JFK Arrivals EWR Arrivals LGA Arrivals 21 clusters 16 clusters 13 clusters North Northeast West South
Data Mining Framework FILTERED AND RESAMPLED FLIGHT TRACKS RAW DATA: OBSERVED FLIGHT TRACKS (ETMS) FOR 69 DAYS 60 nm F1 = (x11, y11, x12, y12,…, x1n, y1n) F2 = (x21, y21, x22, y22,…, x2n, y2n) . . . Fm = (xm1, ym1, xm2 ym2,…, xmn, ymn) TRAINING DATA: 14 days TEST DATA: 55 days CLUSTERING AT SPATIAL SCALE -DBSCAN- CLASSIFICATION -RANDOM FORESTS- CLUSTERING AT TEMPORAL SCALE -HIERARCHICAL CLUSTERING- AIRSPACE STRUCTURE RESOURCE USE MATRIX/VECTOR RESOURCE USE PATTERNS CLUSTER TIME
Data Mining FrameworkClassification Supervised Learning Random Forests
Data Mining FrameworkClustering at Temporal Scale Hourly Resource Use Vectors Vector composed of dominant trajectory clusters from each arrival gate to each airport during the specified time scale: (Csouth-JFK, Csouth-EWR, Csouth-LGA,…, Cnorth-JFK, Cnorth-EWR, Cnorth-LGA) Dissimilarity Matrix Hierarchical Clustering Average linkage Hamming distance (fraction of features that differ)
Resource Use PatternsDominant Aggregate NY Flow Pattern • Clustering of hourly Resource Use Vectors results in 75 clusters (Resource Use Patterns – RUP) • 10 RUP capture 80% of the data • Landing direction • Arrivals or departures favored • Approach procedure South Flow North Flow
Resource Use PatternsSouth Flow RUP 3: S-DF-LGA22/31 RUP 2: S-AF-LGA22/13 RUP 9: S-AF-LGA22/31 RUP 1: S-DF-LGA22/13 IMC VMC VMC IMC VMC IMC VMC IMC Number of flights JFK Arrivals JFK Departures EWR Arrivals EWR Departures LGA Arrivals LGA Departures 15 0
Resource Use PatternsNorth Flow RUP 8: N-DF-VAP@LGA RUP 10: N-AF-IAP@LGA RUP 7: N-AF-VAP@LGA RUP 4: N-DF-IAP@LGA IMC VMC VMC IMC VMC IMC VMC IMC Number of flights JFK Arrivals JFK Departures EWR Arrivals EWR Departures LGA Arrivals LGA Departures 15 0
Resource Use PatternsMixed North and South Flow RUP 6: Mixed-Ndominant-AF RUP 5: Mixed-Sdominant-AF IMC IMC VMC VMC Number of flights JFK Arrivals JFK Departures EWR Arrivals EWR Departures LGA Arrivals LGA Departures 15 0
Throughput and DelayJFK Arrivals IMC VMC VMC IMC
Throughput and DelayJFK Arrivals VMC VMC
Throughput and DelayJFK Arrivals SOUTH NORTH MIXED (1)Source: FAA Management Tips
Summary and Future Work • Data mining framework to characterize traffic flows at spatial and temporal scales • New York Metroplex Terminal Airspace Analysis • Identified the current as-flown terminal area structure • Identified and characterized dominant flow patterns • Assessed arrival capacity based on observed throughput and terminal area delay • Future work • Identify key flow pattern characteristics that increase airspace complexity and reduce capacity • Identify other relevant factors that explain the variability in flow pattern performance • Develop a prediction model for transit times (delay) in the terminal area
Questions? mayara@mit.edu