
Scientific Visualization
E N D
Presentation Transcript
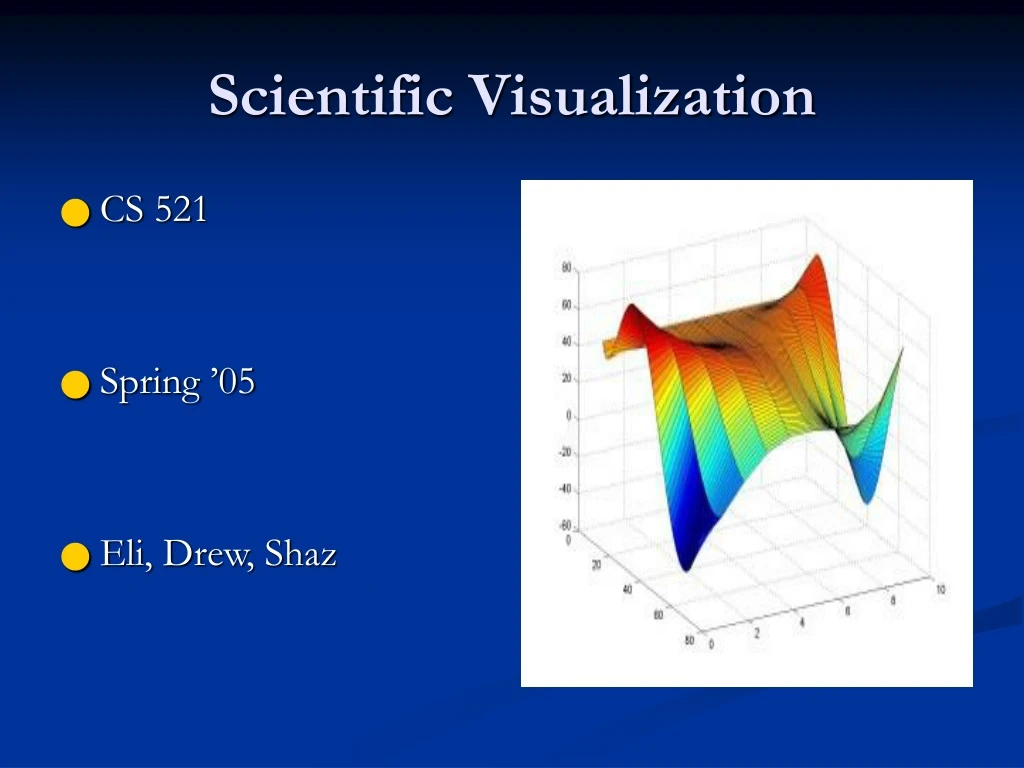
Scientific Visualization • CS 521 • Spring ’05 • Eli, Drew, Shaz
Introduction • SciVis utilizes computer graphics, image processing, signal processing as techniques to analyze numerical data. • It makes it much easier to understand results of complex numerical data analysis • The visualization helps scientists to interact and investigate with certain aspects of the data.
What it is? • The methodology of quickly and effectively representing data. • Humans perceive better than machines, and machines calculate much more consistently and accurately. • It is a combination of graphics capabilities in the 21st century with human perception.
The Need • Ability to deal with the randomness included in natures equations. • The larger amounts of test data capability, results of which are normally harder to see. • The largest test data available to us is one nature provides us with.
Quality Vs. Quantity • Quantity • Provides a bigger picture • Play with the whole data set • Quality • Ability to slice a subset of the data set. • Detail – oriented
History • Three stages of mdmv (multidimensional multivariate visualization) development • Searching stage (1782 – 1976) • Awakening stage (1977 – 1985) • Discovery stage (1987 – 1991)
Searching stage • Mdmv was to be studies long before computer science by statisticians and psychologists • All studies were in 2D xy displays due to lack of technology.
Awakening stage • Tukey came out with data analysis methods • 2D and 3D spatial data was commonly studied during the time. • It was not just a tool anymore but a way of understanding how to decode data
Discovery Stage • Moved away from just data analysis to very high graphical visualizations which required a lot of computation power. • Virtual reality brought new meaning to visualization techniques. • NFS declared the need for 2D/3D spatial visualization.
Breakdown • Independent variable – Dimension • Dependent variable – Variate • Equation – • Y = f(x) • Y is dependent on X
2D Visualization Example • Example of 2D visualization (charts) most commonly used in business applications.
3D Visualization Example • Reynard Motorsport Engineers recognized as leader in Formula 1 and Indy car design use Ensight to study airflows. • Voith hydro to design more efficient hydroelectric turbines less harmful to fish.
Motivations • The availability of increasingly powerful computers with extremely fast internal and external memory. • Compresses a lot of data into one picture (data browsing). • Reveals co-relations between different quantities both in space and time. • Possible to view data selectively and interactively in ‘real time’.
Foundations • Spatial – oriented • Still graphs used, all relevant data is displayed at the same time in a given space • Multiple view vs. multiple symbol • Multiple view – one display panel shows values of multiple variables simultaneously • Multiple symbol – Only one symbol is used but conditional relationships are shown in multiple panels.
Foundations • Temporal Oriented • Also known as Kinematic displays (Tukey and Tukey 1988) • Variations across time are utilized to depict higher dimensions instead of using all variables within given space and time.
References • http://pareonline.net/getvn.asp?v=8&n=17 • http://www.cse.ohio-state.edu/~crawfis/cis694L/ • SciVis presentation of spring ’03 CS521 • http://www.ceintl.com/industries/industries.html