Analyzing Interference Ratios in Nuclear Excitation Events
Explore interference ratios in nuclear excitation with varied zVertex and y ranges. Analyze Minbias and Topology sets using MC simulations to fit the ratio function.

Analyzing Interference Ratios in Nuclear Excitation Events
E N D
Presentation Transcript
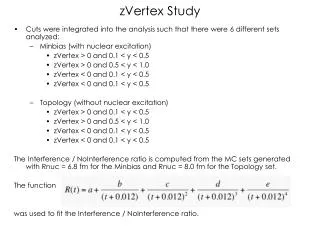
zVertex Study • Cuts were integrated into the analysis such that there were 6 different sets analyzed: • Minbias (with nuclear excitation) • zVertex > 0 and 0.1 < y < 0.5 • zVertex > 0 and 0.5 < y < 1.0 • zVertex < 0 and 0.1 < y < 0.5 • zVertex < 0 and 0.1 < y < 0.5 • Topology (without nuclear excitation) • zVertex > 0 and 0.1 < y < 0.5 • zVertex > 0 and 0.5 < y < 1.0 • zVertex < 0 and 0.1 < y < 0.5 • zVertex < 0 and 0.1 < y < 0.5 The Interference / NoInterference ratio is computed from the MC sets generated with Rnuc = 6.8 fm for the Minbias and Rnuc = 8.0 fm for the Topology set. The function was used to fit the Interference / NoInterference ratio.
minbias • zVertex > 0 • 0.1 < y < 0.5
minbias • zVertex > 0 • 0.5 < y < 1.0
minbias • zVertex < 0 • 0.1 < y < 0.5
minbias • zVertex < 0 • 0.5 < y < 1.0
topology • zVertex > 0 • 0.1 < y < 0.5
topology • zVertex > 0 • 0.5 < y < 1.0
topology • zVertex < 0 • 0.1 < y < 0.5
topology • zVertex < 0 • 0.5 < y < 1.0