Profit Variance Analysis
Profit Variance Analysis. Ken Homa. PVA Profit Variance Analysis. Objective : Disaggregate a change in profits from one period to another by isolating major contributing factors, e.g. Volume Price Inflation (cost) Program spending Productivity. Profit Variance Analysis. Base Profit.

Profit Variance Analysis
E N D
Presentation Transcript
Profit Variance Analysis Ken Homa
PVA Profit Variance Analysis Objective: Disaggregate a change in profits from one period to another by isolating major contributing factors, e.g. • Volume • Price • Inflation (cost) • Program spending • Productivity
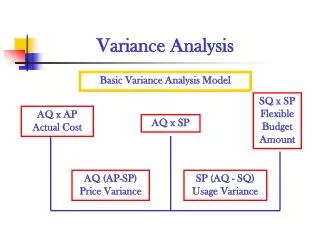
Profit Variance Analysis Base Profit Profit Increase Price Cost Inflation Productivity Programs Volume New Profit
PVA Simplified Analytical Process (Price first) • Restate (inflate) base period (P1) sales using current period (P2) prices,i.e. multiply by any cost increases • Recalculate the profit or loss • Difference in P&L from prior year nominal values is attributable to salesprice • Restate base period costs by multiplying by the cost increases from P1 to P2 • These intermediate results are P1 @ P2 prices & costs • Recalculate the profit or loss • Difference in P&L from prior step values is attributable to cost inflation • Calculate real volume growth • Divide current period (P2) sales by restated (inflated) P1 sales • Answer is ‘real volume growth’ from P1 to P2 continued …
PVA Simplified Analytical Process (Price first, continued) • Apply the real growth factor to all base period (P1) inflated value levels (for sales and costs) • Recalculate the profit or loss • Difference in P&L from prior step values is attributable to volume growth • Subtract the P&L from the prior step to the original current period (P2) P&L (expressed in nominal or “current P2” dollars) • Difference in P&L from prior step values is attributable to productivity • Note: if there is a change in program spending (e.g. productivity enhancing initiatives) … calculate the nominal change year-to-year before calculating productivity • Note: to calculate ‘inflation recovery’, compare the P&L change attributable to price to that attributable to cost inflation, e.g. if ‘price’ is $8,000 and cost inflation is $10,000 then 80% of cost inflation is ‘recovered’ in price
PVA Simplified Analytical Process (Volume first) • Calculate real volume growth: • Restate (inflate) base period (P1) sales using current period (P2) prices • Divide current period (P2) sales by restated P1 sales • Answer is ‘real volume growth’ from P1 to P2 • Apply the real growth factor to all base period (P1) dollar levels • These intermediate results are P2 @ P1 prices & costs • Recalculate the profit or loss • Difference in P&L from P1 nominal values is attributable to volume growth • Using the results from the prior step, restate sales by multiplying by the sales price increase from P1 to P2 • These intermediate results are P2 @ P2 prices, but P1 costs • Recalculate the profit or loss • Difference in P&L from prior step values is attributable to salesprice continued …
PVA Simplified Analytical Process (Volume first,continued) • Using the results from the prior step, restate costs by multiplying by the cost increases from P1 to P2 • These intermediate results are P2 @ P2 prices & costs • Recalculate the profit or loss • Difference in P&L from prior step values is attributable to cost inflation • Subtract the P&L from the prior step to the original current period (P2) P&L (expressed in nominal or “current P2” dollars) • Difference in P&L from prior step values is attributable to productivity • Note: if there is a change in program spending (e.g. productivity enhancing initiatives) … calculate the nominal change year-to-year before calculating productivity • Note: to calculate ‘inflation recovery’, compare the P&L change attributable to price to that attributable to cost inflation, e.g. if ‘price’ is $8,000 and cost inflation is $10,000 then 80% of cost inflation is ‘recovered’ in price