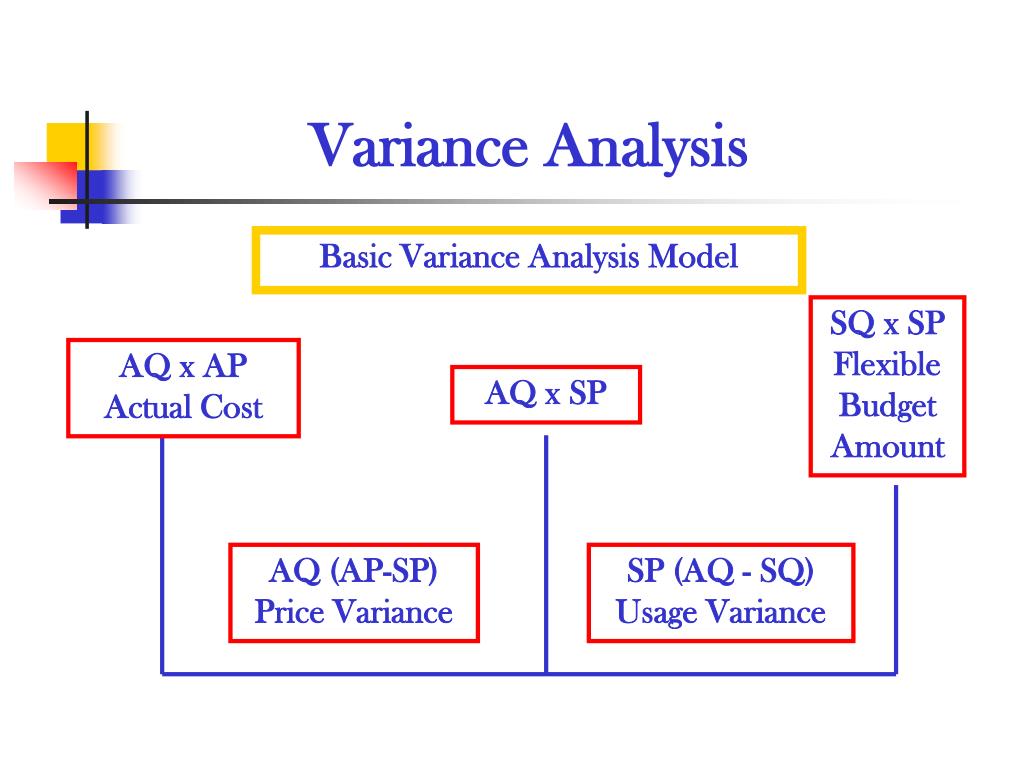
Variance Analysis Basic Variance Analysis Model SQ x SP Flexible Budget Amount AQ x AP Actual Cost AQ x SP AQ (AP-SP) Price Variance SP (AQ - SQ) Usage Variance
Direct Material Variances SQ = 20 ft./unit x 1,600 chairs AQ x AP 33,600 x $1.90 = $63,840 AQ x SP 33,600 x $2.00 =$67,200 SQ x SP 32,000 x $2.00 =$64,000 Price Usage 33,600 ($1.90 - $2.00) $3,360 F $2.00 (33,600 - 32,000) $3,200 U Total Variance = $3,360 F + $3,200 U = $160 F
Direct Material Variances When Quantity Purchased Differs from Quantity Used AQ X AP AQ X SP AQ X SP SQ X SP 35,000 X $1.90 35,000 X $2.00 33,600 X $2.00 32,000 X $2.00 $66,500 $70,000 $67,200 $64,000 $3,500 F $3,200 U Price Variance Usage Variance The model above is used when quantities purchased are not the same as quantities used.
Direct Labor Variances SH = 1,600 chairs X 5 hrs/chair AH X AR AH X SR SH X SR 8,400 X $12.10 8,400 X $12.00 8,000 X $12.00 $101,640 $100,800 $96,000 $840 U $4,800 U Rate Variance Efficiency Variance Total Direct Labor Variance = $840 U + $4,800 U = $5,640 U
Variable Overhead Variances Actual Variable AH X SVR SH X SVR Overhead Expense 8,400 X $3.00 8,000 X $3.00 $23,720 $25,200 $24,000 Spending Variance Efficiency Variance $1,480 F $1,200 U Total Variable Overhead Variance = $1,480 F + $1,200 U = $280 F
Variable Overhead Variances The variable overhead efficiency variance does not measure the efficient use of overhead but rather the efficient use of the cost driver or overhead allocation base used in the flexible budget.
Fixed Overhead Variances Budget Variance: the difference between the amount of fixed overhead actually incurred and the flexible budget amount. Volume Variance: the difference between the flexible budget amount and the amount of fixed overhead appliedto products.
Fixed Overhead Variances Actual Fixed Budgeted Applied Overhead Expense Fixed Overhead Fixed Overhead $16,000 $15,000 $16,000 $1,000 U $1,000 F Spending Variance Volume Variance
Overhead Variances The fixed overhead volume variance should not be interpreted as favorable or unfavorable, or as a measure of the efficient utilization of facilities.
Overhead Variances The advantages of variance analysis for overhead costs are enhanced in companies using Activity-Based Costing (ABC)
Interpreting and Using Variance Analysis An unfavorable direct material usage variance generally points to a problem in production. However, further analysis might reveal that usage was high because of an unusual number of defective parts, and the large number of defective parts was a result of the purchasing manager buying materials of inferior quality.
Variance analysis is most effective in stable companies with mature production environments and has a number of drawbacks when used in many modern manufacturing environments.
Favorable and unfavorable variances should not necessarily be interpreted as good or bad.
Behavioral Considerations Standards Costs and Variance Analysis can provide very useful control and performance evaluations, or they can cause dysfunctional behavior among employees and management.
End of Chapter 10