Confidence Interval Estimation
IE 340/ 440 PROCESS IMPROVEMENT THROUGH PLANNED EXPERIMENTATION. Confidence Interval Estimation. Dr. Xueping Li University of Tennessee. Chapter Topics. Estimation Process Point Estimates Interval Estimates Confidence Interval Estimation for the Mean ( Known)


Confidence Interval Estimation
E N D
Presentation Transcript
IE 340/440 PROCESS IMPROVEMENT THROUGH PLANNED EXPERIMENTATION Confidence Interval Estimation Dr. Xueping Li University of Tennessee © 2003 Prentice-Hall, Inc.
Chapter Topics • Estimation Process • Point Estimates • Interval Estimates • Confidence Interval Estimation for the Mean ( Known) • Determining Sample Size • Confidence Interval Estimation for the Mean ( Unknown) © 2003 Prentice-Hall, Inc.
Chapter Topics (continued) • Confidence Interval Estimation for the Proportion • Confidence Interval Estimation for Population Total • Confidence Interval Estimation for Total Difference in the Population • Estimation and Sample Size Determination for Finite Population • Confidence Interval Estimation and Ethical Issues © 2003 Prentice-Hall, Inc.
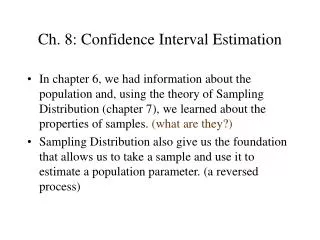
Estimation Process Population Random Sample I am 95% confident that is between 40 & 60. Mean X = 50 Mean, , is unknown Sample © 2003 Prentice-Hall, Inc.
Point Estimates Estimate PopulationParameters … with SampleStatistics Mean Proportion Variance Difference © 2003 Prentice-Hall, Inc.
Interval Estimates • Provide Range of Values • Take into consideration variation in sample statistics from sample to sample • Based on observation from 1 sample • Give information about closeness to unknown population parameters • Stated in terms of level of confidence • Never 100% sure © 2003 Prentice-Hall, Inc.
Confidence Interval Estimates Confidence Intervals Mean Proportion Known Unknown © 2003 Prentice-Hall, Inc.
Confidence Interval for( Known) Critical Value Standard Error • Assumptions • Population standard deviation is known • Population is normally distributed • If population is not normal, use large sample • Confidence Interval Estimate • is called the sampling error or margin of error © 2003 Prentice-Hall, Inc.
Elements of Confidence Interval Estimation • Level of Confidence • Confidence that the interval will contain the unknown population parameter • Precision (Range) • Closeness to the unknown parameter • Cost • Cost required to obtain a sample of size n © 2003 Prentice-Hall, Inc.
Level of Confidence • Denoted by • A Relative Frequency Interpretation • In the long run, of all the confidence intervals that can be constructed will contain (bracket) the unknown parameter • A Specific Interval Will Either Contain or Not Contain the Parameter • No probability involved in a specific interval © 2003 Prentice-Hall, Inc.
Interval and Level of Confidence Sampling Distribution of the Mean _ Intervals extend fromto of intervals constructed contain ; do not. Confidence Intervals © 2003 Prentice-Hall, Inc.
Example PHStat output A random sample of 15 stocks traded on the NASDAQ showed an average shares traded to be 215000. From past experience, it is believed that the population standard deviation of shares traded is 195000 and the shares traded are very close to a normal distribution. Construct a 99% confidence interval for the average shares traded on the NASDAQ. Interpret your result. The 99% CI for the population mean: © 2003 Prentice-Hall, Inc.
Example: Interpretation (continued) If all possible samples of size 15 are taken and the corresponding 99% confidence intervals are constructed, 99% of the confidence intervals that are constructed will contain the true unknown population mean. We are 99% confident that the population average number of shares traded on the NASDAQ is between 85309 and 344690. For this particular confidence interval [85309, 344690], the unknown population mean can either be in the interval or not in the interval. It is, therefore, incorrect to state that the probability is 99% that the unknown population mean will be in the interval [85309, 344690]. © 2003 Prentice-Hall, Inc.
Example: Interpretation (continued) Using the confidence interval method on repeated sampling, the probability that we will have constructed a confidence interval that will contain the unknown population mean is 99%. © 2003 Prentice-Hall, Inc.
Obtaining Confidence Intervalin PHStat • PHStat | Confidence Interval | Estimates for the Mean, Sigma Known © 2003 Prentice-Hall, Inc.
Factors Affecting Interval Width(Precision) • Data Variation • Measured by • Sample Size • Level of Confidence Intervals Extend from X - Z to X + Z x x © 1984-1994 T/Maker Co. © 2003 Prentice-Hall, Inc.
Determining Sample Size (Cost) • Too small: • Won’t do the job • Too Big: • Requires more resources © 2003 Prentice-Hall, Inc.
Determining Sample Sizefor Mean What sample size is needed to be 90% confident of being correct within ± 5? A pilot study suggested that the standard deviation is 45. Round Up © 2003 Prentice-Hall, Inc.
Determining Sample Size for Mean in PHStat • PHStat | Sample Size | Determination for the Mean … • Example in Excel Spreadsheet © 2003 Prentice-Hall, Inc.
Confidence Interval for( Unknown) Standard Error • Assumptions • Population standard deviation is unknown • Population is normally distributed • If population is not normal, use large sample • Use Student’s t Distribution • Confidence Interval Estimate Margin of Error © 2003 Prentice-Hall, Inc.
Student’s t Distribution Standard Normal Bell-Shaped Symmetric ‘Fatter’ Tails t (df = 13) t (df = 5) Z t 0 © 2003 Prentice-Hall, Inc.
Student’s t Table Let: n = 3 df = n - 1 = 2 = .10/2 =.05 Upper Tail Area df .25 .10 .05 1 1.000 3.078 6.314 / 2 = .05 0.817 1.886 2 2.920 3 0.765 1.638 2.353 0 t 2.920 t Values © 2003 Prentice-Hall, Inc.
Example . © 2003 Prentice-Hall, Inc.
Confidence Interval for( Unknown) in PHStat • PHStat | Confidence Interval | Estimate for the Mean, Sigma Unknown • Example in Excel Spreadsheet © 2003 Prentice-Hall, Inc.
Confidence Interval Estimatefor Proportion Standard Error • Assumptions • Two categorical outcomes • Population follows binomial distribution • Normal approximation can be used if and • Confidence Interval Estimate Margin of Error © 2003 Prentice-Hall, Inc.
Example A random sample of 400 voters showed that 32 preferred Candidate A. Set up a 95% confidence interval estimate for p. We are 95% confident that the proportion of voters who prefer Candidate A is somewhere between 0.053 and 0.107. © 2003 Prentice-Hall, Inc.
Confidence Interval Estimate for Proportion in PHStat • PHStat | Confidence Interval | Estimate for the Proportion … • Example in Excel Spreadsheet © 2003 Prentice-Hall, Inc.
Determining Sample Sizefor Proportion Out of a population of 1,000, we randomly selected 100, of which 30 were defective. What sample size is needed to be within ± 5% with 90% confidence? Round Up © 2003 Prentice-Hall, Inc.
Determining Sample Size for Proportion in PHStat • PHStat | Sample Size | Determination for the Proportion … • Example in Excel Spreadsheet © 2003 Prentice-Hall, Inc.
Confidence Interval for Population Total Amount • Point Estimate • Confidence Interval Estimate © 2003 Prentice-Hall, Inc.
Confidence Interval for Population Total: Example An auditor is faced with a population of 1000 vouchers and wishes to estimate the total value of the population of vouchers. A sample of 50 vouchers is selected with the average voucher amount of $1076.39, standard deviation of $273.62. Set up the 95% confidence interval estimate of the total amount for the population of vouchers. © 2003 Prentice-Hall, Inc.
Example Solution The 95% confidence interval for the population total amount of the vouchers is between 1,000,559.15 and 1,152,220.85. © 2003 Prentice-Hall, Inc.
Example Solution in PHStat • PHStat | Confidence Intervals | Estimate for the Population Total • Excel Spreadsheet for the Voucher Example © 2003 Prentice-Hall, Inc.
Confidence Interval for Total Difference in the Population • Point Estimate • where is the sample average difference • Confidence Interval Estimate • where © 2003 Prentice-Hall, Inc.
Estimation for Finite Population • Samples are Selected Without Replacement • Confidence interval for the mean ( unknown) • Confidence interval for proportion © 2003 Prentice-Hall, Inc.
Sample Size (n ) Determination for Finite Population • Samples are Selected Without Replacement • When estimating the mean • When estimating the proportion © 2003 Prentice-Hall, Inc.
Ethical Issues • Confidence Interval (Reflects Sampling Error) Should Always Be Reported Along with the Point Estimate • The Level of Confidence Should Always Be Reported • The Sample Size Should Be Reported • An Interpretation of the Confidence Interval Estimate Should Also Be Provided © 2003 Prentice-Hall, Inc.
Chapter Summary • Illustrated Estimation Process • Discussed Point Estimates • Addressed Interval Estimates • Discussed Confidence Interval Estimation for the Mean ( Known) • Addressed Determining Sample Size • Discussed Confidence Interval Estimation for the Mean ( Unknown) © 2003 Prentice-Hall, Inc.
Chapter Summary (continued) • Discussed Confidence Interval Estimation for the Proportion • Addressed Confidence Interval Estimation for Population Total • Discussed Confidence Interval Estimation for Total Difference in the Population • Addressed Estimation and Sample Size Determination for Finite Population • Addressed Confidence Interval Estimation and Ethical Issues © 2003 Prentice-Hall, Inc.