Interval Estimation of Population Mean: Large and Small Sample Cases
This article presents a comprehensive overview of interval estimation techniques for population means, covering both large (n > 30) and small sample (n < 30) cases. It discusses how to estimate population means when the population standard deviation is known or when it is unknown and must be estimated from the sample. The article provides probability statements about sampling errors, margin of error calculations, and applies these concepts to a practical example involving retail outlets. The goal is to equip readers with techniques for constructing confidence intervals using Excel.

Interval Estimation of Population Mean: Large and Small Sample Cases
E N D
Presentation Transcript
Interval Estimation • Interval estimation of a population mean: Large Sample case • Interval estimation of a population mean: Small sample case.
Interval Estimation of a Population Mean:Large-Sample Case • Sampling Error • Probability Statements about the Sampling Error • Interval Estimation: AssumedKnown • Interval Estimation: Estimated by s
Sampling Error The absolute value of the difference between an unbiased point estimate and the population parameter it estimates is called the sampling error. For the case of a sample mean estimating a population mean, the sampling error is
Knowledge of the sampling distribution of enables us to make probability statements about the sampling error even though the population mean is not known. Probability StatementsAbout the Sampling Error A probability statement about the sampling error is a precision statement.
Sampling distribution of 1 - of all values Precision Statement There is a 1 - probability that the value of a sample mean will provide a sampling error of or less. /2 /2
Sampling distribution of 1 - of all values Interval Estimate of a Population Mean:Large-Sample Case (n> 30) /2 /2 interval does not include m interval includes m interval includes m [------------------------- -------------------------] [------------------------- -------------------------] [------------------------- -------------------------]
where: is the sample mean 1 - is the confidence coefficient z/2 is the z value providing an area of /2 in the upper tail of the standard normal probability distribution s is the population standard deviation n is the sample size Interval Estimate of a Population Mean:Large-Sample Case (n> 30) • Assumed Known
Interval Estimate of a Population Mean:Large-Sample Case (n> 30) • Estimated by s In most applications the value of the population standard deviation is unknown. We simply use the value of the sample standard deviation, s, as the point estimate of the population standard deviation.
D S Example: Discount Sounds Discount Sounds has 260 retail outlets throughout the United States. The firm is evaluating a potential location for a new outlet, based in part, on the mean annual income of the individuals in the marketing area of the new location. A sample of size n = 36 was taken. The sample mean income is $21,100 and the sample standard deviation is $4,500. The confidence coefficient to be used in the interval estimate is .95.
D S 95% of the sample means that can be observed are within + 1.96 of the population mean . Precision Statement Using s as an approximation of s , the margin of error is: There is a .95 probability that the value of a sample mean for Discount Sounds will provide a sampling error of $1,470 or less.
D S Interval Estimate of Population Mean: Estimated by s Interval estimate of is: $21,100 + $1,470 or $19,630 to $22,570 We are 95% confident that the interval contains the population mean.
D S Using Excel to Construct a Confidence Interval: Large-Sample Case • Formula Worksheet Note: Rows 15-37 are not shown.
D S Using Excel to Construct aConfidence Interval: Large-Sample Case • Value Worksheet Note: Rows 15-37 are not shown.
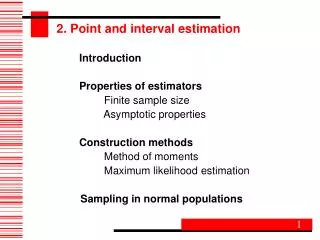
Interval Estimation of a Population Mean:Small-Sample Case (n < 30) • Population is Not Normally Distributed • The only option is to increase the sample size to • n> 30 and use the large-sample interval-estimation • procedures.
Interval Estimation of a Population Mean:Small-Sample Case (n < 30) • Population is Normally Distributed: Assumed Known • The large-sample interval-estimation procedure can • be used.
Interval Estimation of a Population Mean:Small-Sample Case (n < 30) • The appropriate interval estimate is based on a • probability distribution known as the t distribution. • Population is Normally Distributed: Estimated by s
t Distribution The t distribution is a family of similar probability distributions. A specific t distribution depends on a parameter known as the degrees of freedom. As the number of degrees of freedom increases, the difference between the t distribution and the standard normal probability distribution becomes smaller and smaller. A t distribution with more degrees of freedom has less dispersion.
Degrees of Freedom Degrees of freedom (df) refers to the number of independent pieces of information that go into the computation of
Example Note that the 5th value of x must be 54—given the values of x1, . . .x4. Thus 5-1 or 4 values of x are independent. Note that
t Distribution t distribution (20 degrees of freedom) Standard normal distribution t distribution (10 degrees of freedom) z, t 0
t Distribution • a/2 Area or Probability in the Upper Tail /2 t 0 ta/2
Interval Estimation of a Population Mean:Small-Sample Case (n < 30) and Estimated by s • Interval Estimate where: 1 - = the confidence coefficient t/2 = the t value providing an area of /2 in the upper tail of a t distribution with n - 1 degrees of freedom s = the sample standard deviation
Example: Apartment Rents • Interval Estimation of a Population Mean: Small-Sample Case (n < 30) with Estimated by s A reporter for a student newspaper is writing an article on the cost of off-campus housing. A sample of 10 studio apartments within a half-mile of campus resulted in a sample mean of $550 per month and a sample standard deviation of $60.
Example: Apartment Rents • Interval Estimation of a Population Mean: Small-Sample Case (n < 30) with Estimated by s Let us provide a 95% confidence interval estimate of the mean rent per month for the population of studio apartments within a half-mile of campus. We will assume this population to be normally distributed.
Interval Estimation of a Population Mean:Small-Sample Case (n < 30) and Estimated by s • Interval Estimate where: 1 - = the confidence coefficient t/2 = the t value providing an area of /2 in the upper tail of a t distribution with n - 1 degrees of freedom s = the sample standard deviation
Example: Apartment Rents • Interval Estimation of a Population Mean: Small-Sample Case (n < 30) with Estimated by s Let us provide a 95% confidence interval estimate of the mean rent per month for the population of studio apartments within a half-mile of campus. We will assume this population to be normally distributed.
Interval Estimation of a Population Mean:Small-Sample Case (n < 30) and Estimated by s At 95% confidence, = .05, and /2 = .025. t.025 is based on n- 1 = 10 - 1 = 9 degrees of freedom. In the t distribution table we see that t.025 = 2.262.
= 550 + 42.92 Interval Estimation of a Population Mean:Small-Sample Case (n < 30) and Estimated by s • Interval Estimate We are 95% confident that the mean rent per month for the population of studio apartments within a half-mile of campus is between $507.08 and $592.92.
Using Excel to Construct aConfidence Interval: s Estimated by s • Formula Worksheet
Using Excel to Construct aConfidence Interval: s Estimated by s • Value Worksheet
Using Excel’sDescriptive Statistics Tool Excel’s Descriptive Statistics tool can also be used to compute the margin of error when the t distribution is used for a confidence interval estimate of a population mean.
Using Excel’sDescriptive Statistics Tool • Descriptive Statistics Dialog Box
Using Excel’sDescriptive Statistics Tool • Value Worksheet
Exercise 15, p. 334 • The following data were collected for a sample from a normal population: 10, 8, 12, 15, 13, 11, 6, 5 • What is the point estimate the population mean? • What is the point estimate of the population standard deviation? • What is the 95 percent confidence interval for the point estimate of the mean?
Exercise 15, p. 334 (a) (b) (c)
Summary of Interval Estimation Procedures for a Population Mean Yes No n > 30 ? No Popul. approx. normal ? s known ? Yes Yes Use s to estimate s No s known ? No Use s to estimate s Yes Increase n to > 30