Download
1 / 13
130 likes | 206 Vues
Explore the likelihood of women's childbearing decisions and progression speed to subsequent childbirth through a study on Portuguese women aged 19-71. The research delves into factors influencing the number of children and birth timing, utilizing split-population survival estimation. Discover how education, siblings, age at birth, and economy play key roles in shaping fertility patterns. Uncover insights on the impact of education on delaying childbirth and the probability of having multiple children. Gain valuable data on the trends of childbearing decisions across different cohorts and economic conditions. The study's robust results and implications warrant further exploration in understanding women's childbearing behaviors.

E N D
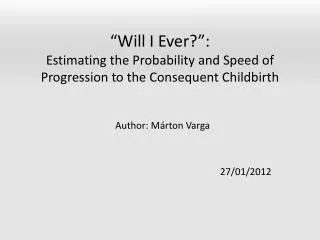
“Will I Ever?”:Estimating the Probability and Speed of Progression to the Consequent Childbirth Author: Márton Varga 27/01/2012
QUESTIONS DATA and METHODOLOGY • How many children will women have? • When do they give birth? • Main source: Fertility and Family Survey • Sample: 5484 Portuguese women (1947-79) • Technique: Split-population survival estimation
Education MAIN RESULTS Siblings • Education leads to delayed childbearing and a longer interval between the second and third birth. University graduates are more likely to have the third child. • More siblings are associated with a higher probability of having the second child. • Younger cohorts are more likely to postpone childbearing, to remain childless, and to have fewer children. Age at birth Other Economy Cohort • Changes in the unemployment rate and childcare availability do not influence fertility timing. • Mothers, who were older at their last delivery, have a lower probability of the consequent birth, but they wait less if they decide to have another child. • 10% remain childless, 30 % stop at one child, while 70% stop at two children.
FIGURE 1. KAPLAN MEIER SURVIVAL ESTIMATES Note: Duration is measured from the age of 14 and from the 3rd quarter after the last birth.
Important THE SPLIT-POPULATION MODEL
Education Siblings Economy Cohort
Education Siblings Age at birth Economy Cohort
Education Siblings Age at birth Economy Cohort
70.4% stop at two children Probability of stop at two children 33.9% Probability of stop at two children 81.7% Probability of stop at two children 86.3%
FINAL REMARKS • Results are robust • Results are plausible • Deserves more investigation