Download
1 / 12
130 likes | 215 Vues
Explore sensor-based technology to optimize N and P fertilization for Virginia corn and wheat production. Experiment with foliar P applications to enhance yields.

E N D
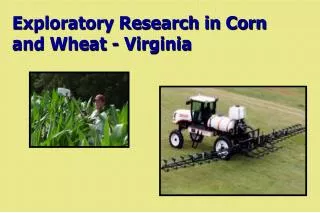
Exploratory Research in Corn and Wheat - Virginia
0.9 7 0.8 6 0.7 5 0.6 NDVI 0.5 Yield, Mg ha-1 4 0.4 3 0.3 2 0.2 0.1 1 0 0 0 0.001 0.002 0.003 0.004 0.005 0.006 0.007 Tiller Density Predicted Yield Index 0 500 1000 1500 2000 Previous Virginia Research • Spring N rates for VA wheat production can be determined using spectral reflectance sensors and applied at a 4-ft2 resolution using commercial equipment
Standard VA Rotation(3 crops in 2 years) No-tillCorn Conv.-tillWheat No-tillDCSoybean
Objectives • Refine current methods of determining variable topdress N rates and incorporate foliar P recommendations into fertilization algorithms for wheat using sensor-based technology • Develop a sensor-based N and P fertilization strategy for Virginia corn production • Evaluate the benefits of foliar P applications for wheat and corn production
TREATMENT STRUCTURE Trt GS 25 N GS 30 N Resolution ------- lb N / acre ------- 1 0 0 NONE 2 30 60 FLAT RATE 3 0 120 FLAT RATE 4 60 60 FLAT RATE 5 120 0 FLAT RATE 2 6 0 NFOA 1 m 2 7 TILLER NFOA 1 m 8 TILLER TISSUE FLAT RATE 2 2 13 9 0 0 NFOA2 NFOA3 1 m 1 m 2 2 Year 2 10 14 TILLER TILLER NFOA2 NFOA3 1 m 1 m 2 2 15 11 0 0 NFOA2+PFOA1 NFOA3+PFOA2 1 m 1 m 2 2 16 12 TILLER TILLER NFOA3+PFOA2 NFOA2+PFOA1 1 m 1 m Year 3 Experimental Procedures - Obj. 1 • 6 site years (2 in each of 3 yr) • RCBD; 3 replications
Experimental Procedures - Obj. 2 • 12 site years (4 sites in each of 3 yr) • Irrigated and non-irrigated • Conventional and no till • RCBD; 3 replications • Preplant N (0 to 240 lb N/acre) • Starter N (0 to 70 lb N/acre) • Sidedress N (0 to 150 lb N/acre) • Plots will be fertilized and harvested using conventional plot equipment
Experimental Procedures - Obj. 2 Spectral measurements collected from canopy at V4, V6, V8, and V10 Chlorophyll and tissue N and P will be measured at same growth stages A PSNT will be conducted for each treatment prior to sidedress N applications at V6
180 150 Dryland, No N 120 Irrigated, No N Yield, bu/acre 90 Dryland, Added N 60 Irrigated, Added N 30 0 0 0.1 0.2 0.3 0.4 0.5 0.6 0.7 0.8 0.9 NDVI, V8 Preliminary Results - Obj. 2
Foliar P Applications in Virginia • Determine from soil test • Residual P can carry over from starter application to previous crops • P can be banded with wheat crop
Foliar P Application Preplant P2O5 Tiller Density Grain Yield -- lb/acre -- -- tillers/ft2 -- -- bu/acre -- 0 50 83 30 70 85 60 80 96 90 95 93 120 95 95 Foliar P No preplant P 90 lb P2O5 -- lb P2O5/acre -- -- bu/acre -- -- bu/acre -- 0 77 90 4 84 90 8 84 93 12 87 98 PHOSPHORUS RESPONSE
Experimental Procedures - Obj. 3 • 12 site years (4 sites in each of 3 yr) • 2 corn and 2 wheat • No till • Preplant P STP 1/3 STP 2/3 STP • Foliar P rates 0, 4, 8, and 12 lb P2O5/acre for wheat (double for corn) • Applied at GS30 or V6
Expected Results • Virginia producers will have the knowledge required to implement existing variable-rate fertilizer technology into standard cash grain production systems • Grain yields will increase by applying nutrients at the resolution where variability exists • Nitrogen use efficiency will increase 30 to 50% while soil-applied P fertilizer will be reduced 50 to 100%