Download

1 / 16
180 likes | 330 Vues
Functional Genomics and Computational Biology in Cancer Research. John Quackenbush February 4, 2009. Public HGP. Celera Genomics. February 2001: Completion of the Draft Human Genome. May 2006: The “complete” human genome sequence is announced.

E N D
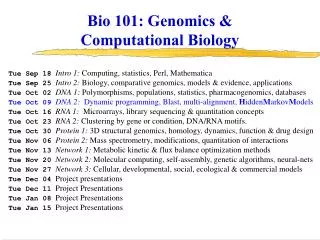
Functional Genomics and Computational Biology in Cancer Research John Quackenbush February 4, 2009
Public HGP Celera Genomics February 2001: Completion of the Draft Human Genome May 2006: The “complete” human genomesequence is announced
The Genome Project has provided a “parts list” for a human cell
Different cell types express different sets of genes Neuron Thyroid Cell Lung Cell Cardiac Muscle Pancreatic Cell Kidney Cell Skeletal Muscle Skin Cell
PRODUCTION Rooms of equipment Subcloning > picking > prepping 35 FTEs 3-4 weeks SEQUENCING 74x Capillary Sequencers 10 FTEs 15-40 runs per day 1-2Mb per instrument per day 120Mb total capacity per day 2006: State of the Art Sequencing Sequencing the genome took ~15 years and $3B
PRODUCTION 1x Cluster Station 1 FTE 1 day SEQUENCING 1x Genome Analyzer Same FTE as above 1 run per 3 days 1Gb per instrument per run >300Mb per day 2008: Enabling a New Era in Genome Analysis We can now re-sequence the genome in a ~2 weeks
Why Computational Biology? New technologies inspired by the Human Genome Project are transforming biomedical research from a laboratory science to an information science We need new approaches to making sense of the data we generate The best way to develop new methods is to address real problems In many ways, we are like the early telescope makers – we build tools that also enable research beyond our own.
Beating Information Overload Improved Diagnostics Individualized Therapies More Effective Agents Like “Google” for Medicaland Biological Data Cytogenomics Genomics Clinical Data Metabolomics Transcriptomics Proteomics Epigenomics CentralWarehouse Chemical Biology Published Datasets PubMed The Genome Clinical Trials The HapMap DrugBank Etc. Disease Databases (OMIM)
2004 Estimated US Cancer Deaths* Men290,890 Women272,810 Lung & bronchus 32% Prostate 10% Colon & rectum 10% Pancreas 5% Leukemia 5% Non-Hodgkin 4%lymphoma Esophagus 4% Liver & intrahepatic 3%bile duct Urinary bladder 3% Kidney 3% All other sites 21% 25% Lung & bronchus 15% Breast 10% Colon & rectum 6% Ovary 6% Pancreas 4% Leukemia 3% Non-Hodgkin lymphoma 3% Uterine corpus 2% Multiple myeloma 2% Brain/ONS 24% All other sites ONS=Other nervous system. Source: American Cancer Society, 2004.
Early Detection of Breast Cancer Can we look in the tissue surrounding a breast tumor to find a gene expression “signature” indicating its presence? NORMAL TISSUE CANCER TISSUE Aedin Culhane, Timothy Yeatman
Breast Cancer Subtypes Survival Different subtypes have different survival profiles Aedin Culhane, Timothy Yeatman
Ten Genes in Adjacent Tissue Distinguish Breast Cancer Subtypes Subtype Luminal A Basal histologically normal tissue Aedin Culhane, Timothy Yeatman
2004 Estimated US Cancer Deaths* Men290,890 Women272,810 Lung & bronchus 32% Prostate 10% Colon & rectum 10% Pancreas 5% Leukemia 5% Non-Hodgkin 4%lymphoma Esophagus 4% Liver & intrahepatic 3%bile duct Urinary bladder 3% Kidney 3% All other sites 21% 25% Lung & bronchus 15% Breast 10% Colon & rectum 6% Ovary 6% Pancreas 4% Leukemia 3% Non-Hodgkin lymphoma 3% Uterine corpus 2% Multiple myeloma 2% Brain/ONS 24% All other sites ONS=Other nervous system. Source: American Cancer Society, 2004.
Cancer Death Rates per 100,000 *Age-adjusted to the 2000 US standard population. Source: US Mortality Public Use Data Tapes 1960-2000, US Mortality Volumes 1930-1959, National Center for Health Statistics, Centers for Disease Control and Prevention, 2003. Ovarian Cancer is one of the few with an increasing death rate
Gene Expression: A First Look • Hierarchical clustering of the data shows three distinct sample subgroups that do not correlate with platinum resistant or platinum sensitive status • A variety of statistical tests have failed to identify a strong separation between response groups.
Why Dana-Farber? This is the premier Cancer Research Institutein the world. The most important resource we have for understanding the causes of cancer are the patients themselves. There is no place that I have seen where there is a greater sense of community involvement. The patients and the staff realize that beating cancer requires a partnership, a commitment,and an investment. There is a understanding that developing research requires enabling research.