Download
1 / 59
590 likes | 679 Vues
Discover strategies to uplift B, C, and D students, aiming to surpass potential and bridge the achievement gap. Learn about the impact of challenging curriculum, setting high expectations, and fostering a college-bound culture in secondary schools. Uncover the significance of academic rigor, rigorous coursework, and the benefits of Advanced Placement (AP) programs in boosting college success. Equip students with the tools to excel in diverse academic environments and build a foundation for lifelong learning and achievement. Make informed choices in education to create equitable opportunities for all learners.

E N D
Raising Academic Performance for Students in the Middle Dr. Betty Krohn, AVID Texas Program Manager Ben Solomon, AVID Texas Program Manager
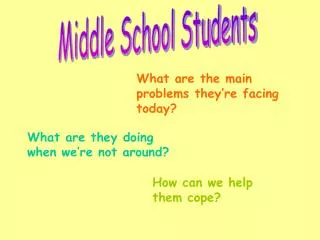
Who is in the Middle? Think about students with whom you have been associated that you consider to be “in the middle.” What is it about these students that puts them “in the middle?”
B, C, and D Students • Falling short of their potential • Capable of completing rigorous curriculum • First in family to attend college • Historically underrepresented in four-year colleges • and universities • Economically disadvantaged Who are they? Students in the academic middle
Challenges and Choices: Raising Achievement and Closing Gaps
Low Expectations Underlying Everything Is the Cycle of Low Expectations Poor Test Results Less Challenging Courses Low Level Assignments/ Instruction
National Rates National Rates Race and ethnic graduation rates based on the Urban Institute’s Cumulative Promotion Index. Disability graduation rate is from National Council on Disability, 24th Annual Report to Congress. Realize the Dream, National Report Card on Education and Equal Opportunity, accessed 10/3/2005: http://realizethedream.civilrights.org/scorecards/national.cfm
Of 100 Kindergarteners… U.S. Department of Commerce, Bureau of the Census. March Current Population Surveys, 1971-2001, In The Condition of Education, 2002.
College Graduates by Age 24 Young people from High 75% Income families Young people from Low 9% Income families Tom Mortenson, Postsecondary Educational Opportunity.
Nearly 75% of high school graduates enter colleges, • but only 12% of these students have completed a significant college-prep curriculum.* • Consequences: • High percentages of students requiring remediation • Low bachelor’s degree completion rates The Reality... Kati Haycock, Closing the Achievement Gap, Educational Leadership, 2007.
Students Who Require Remediation Are Less Likely to Earn a Degree Cliff Adelman, Cliff in Crosstalk. Vol. 6 No.3, Summer 1998.
Challenging Curriculum Results in Lower Failure Rates, Even for Lowest Achievers Ninth-grade English performance, by high/low level course, and eighth-grade reading achievement quartiles SREB, “Middle Grades to High School: Mending a Weak Link”. Unpublished Draft, 2002.
In the end, we have to make different choices. Achievement and opportunity gaps come from choices that educators and policymakers make. Choices about: • How much to spend on whom • What to expect of different schools and students • Who teaches whom • How to organize classrooms and schools
To develop an equitable College-Going Culture in secondary schools… Change Sought... “College by design, not by chance”
Meeting the Challenge • To help all students do rigorous work and meet or exceed high standards in each content area, we must help students: • Develop as readers and writers. • Develop deep content knowledge. • Know content specific strategies for reading, writing, thinking and talking. • Develop habits, skills, and behaviors to use knowledge and skills.
Transcript Study: “the single biggest predictor of college success is the quality and intensity of students’ high school curriculum” Academic Preparation Cliff Adelman, Answers in the Tool Box, U.S. Department of Education, 1999.
What is Academic Rigor? Rigor is the goal of helping students develop the capacity to understand content that is complex, ambiguous, provocative, and personally or emotionally challenging. Taking rigorous courses opens doors! Teaching What Matters Most; Standards and Strategies for Raising Student Achievement by Strong, Silver and Perini, ASCD, 2001.
What Rigor Looks Like for ALL Students… • qualitatively different academic environments • no predetermined limits • development of deep understanding • consistent engagement in sophisticated • investigations • building inquiry-based learning communities
What Rigor Looks Like for ALL Students… • building upon interests, strengths and personal goals • teachers and students as risk-takers • creation of life-long learners and thinkers • encouragement of independent investigation • acceptance of responsibility
Academically well-prepared students are likely to graduate from college regardless of their social background. Unprepared students of all backgrounds are not likely to do so. Academic Preparation Adelman, 1999 American Educator, 2004
AP and College Success Students who take AP courses and exams are much more likely than their peers to complete a bachelor’s degree in four years or less. Camara, Wayne (2003). College Persistence, Graduation, and Remediation. College Board Research Notes (RN-19). New York, NY: College Board.
Impact of AP on 5-Year College Graduation Rates Chrys Dougherty, Lynn Mellor, and ShulingJian, The Relationship Between Advanced Placement and College Graduation (National Center for Educational Accountability, 2005)
Advancement Via Individual Determination [L. avidus]: eager for knowledge
Superman – Gifted & Talented • Superman is naturally Gifted & Talented. • He does not need any special help or toys and gadgets • to be successful. • He just flies and is blessed with powers naturally. • Batman – AVID Students • Batman is just as capable as Superman, but he needs: • Alfred the Butler (AVID Teacher), • Special toys and gadgets (AVID Classroom and WICR), and • Robin (AVID tutors and peers) Superman vs. Batman
Classroom curriculum • Academic instruction • Instructional tools • Tutorial support • Student connections • Professional development AVID Program Components
WICR • Writing to learn • Inquiry • Collaboration • Reading to learn • Study Skills Academic Instruction
Instructional Tools • Cornell Note Taking • Planners/Time Management • Binders/Organizational Skills • AVID Curriculum Library
Tutorial Program • Collaborative Tutorial • Socratic method • Costa’s levels of questioning • 1 college tutor for every 7 students
Colleges and Universities AVID Support Staff Community Parents AVID Coordinator (AVID Elective Teacher) Student Student Administration Tutors Subject Area Teachers Counselors Collaborative Support for the Success of Students
Teacher/adult advocate • Supportive peer groups • Community service activities • Extracurricular activities and leadership opportunities • Motivational activities • Career and college exploration Student Connections
Professional Development • Summer Institute • District Director training • Content area PATH trainings • Tutor training • Regional workshops
Teachers benefit from... • Involvement in a systemic and curricular approach • Initial in-depth staff development and ongoing • support in regions and districts • Focus on results • Accountability • Site team work • Increased leadership
AVID and Classroom Instruction That Works Effective Instruction by Meta-Analysis • examines average effect of 1251 experimental studies • focuses on instructional strategies with high probability of • success for all pupils, K-12, in all subjects • expresses results as effect size • (An effect size of 1 = 34 percentile point gain) Classroom Instruction That Works (2001, ASCD) , Marzano, Pickering, & Pollock, page 4-7.
Categories of Instructional Strategies That Affect Student Achievement • Identifying similarities and differences 45%* • Summarizing and note-taking 34% • Reinforcing effort & providing recognition 29% • Homework and practice 28% • Nonlinguistic representations 27% • Cooperative learning 27% • Setting objectives & providing feedback 23% • Generating and testing hypotheses 23% • Questions, cues, & advance organizers 22% • *Increase in achievement (percentile) of the experimental group compared to the control group Classroom Instruction That Works (2001, ASCD) , Marzano, Pickering, & Pollock, page 7.
Accelerates under-achieving students into more rigorous courses • Teaches academic skills not targeted in other classes • Provides intensive support with in-class tutors and a strong student/teacher relationship • Creates a positive peer group for students • Develops a sense of hope for personal achievement gained through hard work and determination Why AVID Works
In AVID students are challenged with rigorous curriculum, but they are also taught: • Leadership Skills • Study Skills • Organizational Skills • Goal Setting • Student Success Skills • Social Skills AVID Teaches the “Hidden” Curriculum
AVID Strengthens • Middle school/high school articulation • Accountability • Comprehensive professional development • A district-wide focus on results
Builds Partnerships: • Collaboration with College Board • Partners in state and federal grants • Partners with community organizations • Partners with parents • Partners with counseling programs • Collaboration with college outreach programs How AVID Supports School Wide Change
How AVID Supports School Wide Change • Creates a College Going Culture: • Site team focused on a college-going culture • College field trips and research projects • College tutors as role models • College going data to guide district plan • Guest speakers • Increased AP and Pre-AP participation, especially for minority students • Implements research based, best instructional practices for all students in the school
The success of AVID persists despite differences in: school location school ethnic distribution school poverty level
AVID in Texas • San Antonio ISD implemented AVID in1997. • In 2008/2009, AVID is in 105 school districts and 2 charter programs, serving approximately 600 campuses. • The Texas AVID program is the second largest in the nation. • AVID is a state approved, innovative elective course with PEIMS numbers for AVID I – IV. • AVID Professional Development trainings have been approved to receive continuing professional development credit by the Texas State Board of Educator Certification.
AVID Results in Texas • AVID seniors had a 97.7% graduation rate. • AVID seniors boasted an SAT and/or ACT taking rate of 86.2%. • 91.8% of AVID graduates completed four-year college entrance requirements. • 77.5% of seniors who applied to 4-year college • and were accepted. (n = 1680) Data gathered in 2008-09 about AVID’s 2009 seniors. n = 1680
AVID Growth in Texas High Schools Implementing AVID 2008-09 246 Sites Middle Schools Implementing AVID 2008-09 280 Sites
AVID Growth in Texas High Schools Implementing AVID 2008-09 23,547 Students Middle Schools Implementing AVID 2008-09 18,937 Students
AVID in Texas (2007-08) with AVID 2008-09 2008-09 AVID 21% 62% 14% 61.5% State of Texas Demographics AVID Student Demographics
AVID in Texas – TAKS Data TAKS Performance (% Passing) with Demographic Comparisons: State of Texas vs. AVID in 2007-2008
TAKS Performance (% Passing) with Demographic Comparisons: State of Texas vs. AVID in 2007-2008
AVID in Texas – College Readiness Indicators Percent of Graduates in 2006-2007 2006-2007 State of Texas 2006-2007 AVID in Texas
AVID Results in Texas In August of 2007, Northside ISD, in San Antonio, implemented AVID at the middle school level.