Pin Tutorial
Pin Tutorial. Kim Hazelwood David Kaeli Dan Connors Vijay Janapa Reddi. About Us. Kim Hazelwood Assistant Professor at University of Virginia Tortola Research Group: HW/SW Collaboration, Virtualization David Kaeli Full Professor at Northeastern University


Pin Tutorial
E N D
Presentation Transcript
Pin Tutorial Kim Hazelwood David Kaeli Dan Connors Vijay Janapa Reddi
About Us • Kim Hazelwood • Assistant Professor at University of Virginia • Tortola Research Group: HW/SW Collaboration, Virtualization • David Kaeli • Full Professor at Northeastern University • NUCAR Research Group: Computer Architecture • Dan Connors • Assistant Professor at University of Colorado • DRACO Research Group: Compilers, Instrumentation • Vijay Janapa Reddi • Ph.D. Student at Harvard University • VM Optimizations, VM Scalability
Agenda • Pin Intro and Overview • Fundamental Compiler/Architecture Concepts using Pin • Advanced Compiler/Architecture Concepts using Pin • Exploratory Extensions and Hands-On Workshop
What is Instrumentation? • A technique that inserts extra code into a program to collect runtime information • Instrumentation approaches: • Source instrumentation: • Instrument source programs • Binary instrumentation: • Instrument executables directly
Why use Dynamic Instrumentation? • No need to recompile or relink • Discover code at runtime • Handle dynamically-generated code • Attach to running processes
How is Instrumentation used in Compiler Research? Program analysis • Code coverage • Call-graph generation • Memory-leak detection • Instruction profiling Thread analysis • Thread profiling • Race detection
How is Instrumentation used in Computer Architecture Research? • Trace Generation • Branch Predictor and Cache Modeling • Fault Tolerance Studies • Emulating Speculation • Emulating New Instructions
Advantages of Pin Instrumentation • Easy-to-use Instrumentation: • Uses dynamic instrumentation • Do not need source code, recompilation, post-linking • Programmable Instrumentation: • Provides rich APIs to write in C/C++ your own instrumentation tools (called Pintools) • Multiplatform: • Supports x86, x86-64, Itanium, Xscale • Supports Linux, Windows, MacOS • Robust: • Instruments real-life applications: Database, web browsers, … • Instruments multithreaded applications • Supports signals • Efficient: • Applies compiler optimizations on instrumentation code
Using Pin • Launch and instrument an application $ pin –t pintool –- application Instrumentation engine (provided in the kit) Instrumentation tool (write your own, or use one provided in the kit) • Attach to and instrument an application $ pin –t pintool –pid 1234
Pin Instrumentation APIs • Basic APIs are architecture independent: • Provide common functionalities like determining: • Control-flow changes • Memory accesses • Architecture-specific APIs • e.g., Info about segmentation registers on IA32 • Call-based APIs: • Instrumentation routines • Analysis routines
Instrumentation vs. Analysis • Concepts borrowed from the ATOM tool: • Instrumentation routinesdefine where instrumentation is inserted • e.g., before instruction C Occurs first time an instruction is executed • Analysis routinesdefine what to do when instrumentation is activated • e.g., increment counter C Occurs every time an instruction is executed
counter++; counter++; counter++; counter++; counter++; Pintool 1: Instruction Count • sub $0xff, %edx • cmp %esi, %edx • jle <L1> • mov $0x1, %edi • add $0x10, %eax
Pintool 1: Instruction Count Output $ /bin/lsMakefile imageload.out itrace proccount imageload inscount0 atrace itrace.out $ pin -t inscount0 -- /bin/ls Makefile imageload.out itrace proccount imageload inscount0 atrace itrace.out • Count 422838
ManualExamples/inscount0.cpp #include <iostream> #include "pin.h" UINT64 icount = 0; void docount() { icount++; } void Instruction(INS ins, void *v) { INS_InsertCall(ins, IPOINT_BEFORE, (AFUNPTR)docount, IARG_END); } void Fini(INT32 code, void *v) { std::cerr << "Count " << icount << endl; } int main(int argc, char * argv[]) { PIN_Init(argc, argv); INS_AddInstrumentFunction(Instruction, 0); PIN_AddFiniFunction(Fini, 0); PIN_StartProgram(); return 0; } analysis routine instrumentation routine Same source code works on the 4 architectures Pin automatically saves/restores application state
Print(ip); Print(ip); Print(ip); Print(ip); Print(ip); Pintool 2: Instruction Trace • sub $0xff, %edx • cmp %esi, %edx • jle <L1> • mov $0x1, %edi • add $0x10, %eax Need to pass ip argument to the analysis routine (printip())
Pintool 2: Instruction Trace Output $ pin -t itrace -- /bin/lsMakefile imageload.out itrace proccount imageload inscount0 atrace itrace.out • $ head -4 itrace.out 0x40001e90 0x40001e91 0x40001ee4 0x40001ee5
ManualExamples/itrace.cpp argument to analysis routine • #include <stdio.h> • #include "pin.H" • FILE * trace; • void printip(void *ip) { fprintf(trace, "%p\n", ip); } • void Instruction(INS ins, void *v) { • INS_InsertCall(ins, IPOINT_BEFORE, (AFUNPTR)printip, IARG_INST_PTR, IARG_END); • } • void Fini(INT32 code, void *v) { fclose(trace); } • int main(int argc, char * argv[]) { • trace = fopen("itrace.out", "w"); • PIN_Init(argc, argv); • INS_AddInstrumentFunction(Instruction, 0); • PIN_AddFiniFunction(Fini, 0); • PIN_StartProgram(); • return 0; • } analysis routine instrumentation routine
Examples of Arguments to Analysis Routine • IARG_INST_PTR • Instruction pointer (program counter) value • IARG_UINT32 <value> • An integer value • IARG_REG_VALUE <register name> • Value of the register specified • IARG_BRANCH_TARGET_ADDR • Target address of the branch instrumented • IARG_MEMORY_READ_EA • Effective address of a memory read And many more … (refer to the Pin manual for details)
cmp %esi, %edx jle <L1> mov $0x1, %edi count() count() count() <L1>: mov $0x8,%edi Instrumentation Points • Instrument points relative to an instruction: • Before (IPOINT_BEFORE) • After: • Fall-through edge (IPOINT_AFTER) • Taken edge (IPOINT_TAKEN_BRANCH)
Instrumentation Granularity • Instruction • Basic block • A sequence of instructions terminated at a control-flow changing instruction • Single entry, single exit • Trace • A sequence of basic blocks terminated at an unconditional control-flow changing instruction • Single entry, multiple exits Instrumentation can be done at three different granularities: sub $0xff, %edx cmp %esi, %edx jle <L1> mov $0x1, %edi add $0x10, %eax jmp <L2> 1 Trace, 2 BBs, 6 insts
counter++; counter++; counter++; counter++; counter++; Recap of Pintool 1: Instruction Count sub $0xff, %edx cmp %esi, %edx jle <L1> mov $0x1, %edi add $0x10, %eax Straightforward, but the counting can be more efficient
Pintool 3: Faster Instruction Count counter += 3 sub $0xff, %edx cmp %esi, %edx jle <L1> mov $0x1, %edi add $0x10, %eax basic blocks (bbl) counter += 2
ManualExamples/inscount1.cpp • #include <stdio.h> • #include "pin.H“ • UINT64 icount = 0; • void docount(INT32 c) { icount += c; } • void Trace(TRACE trace, void *v) { • for (BBLbbl = TRACE_BblHead(trace); • BBL_Valid(bbl); bbl = BBL_Next(bbl)) { • BBL_InsertCall(bbl, IPOINT_BEFORE, (AFUNPTR)docount, • IARG_UINT32, BBL_NumIns(bbl), IARG_END); • } • } • void Fini(INT32 code, void *v) { • fprintf(stderr, "Count %lld\n", icount); • } • int main(int argc, char * argv[]) { • PIN_Init(argc, argv); • TRACE_AddInstrumentFunction(Trace, 0); • PIN_AddFiniFunction(Fini, 0); • PIN_StartProgram(); • return 0; • } analysis routine instrumentation routine
Modifying Program Behavior • Pin allows you not only to observe but also change program behavior • Ways to change program behavior: • Add/delete instructions • Change register values • Change memory values • Change control flow
Instrumentation Library • #include <iostream> • #include "pin.H" • UINT64 icount = 0; • VOID Fini(INT32 code, VOID *v) { • std::cerr << "Count " << icount << endl; • } • VOID docount() { • icount++; • } • VOID Instruction(INS ins, VOID *v) { • INS_InsertCall(ins, IPOINT_BEFORE,(AFUNPTR)docount, IARG_END); • } • int main(int argc, char * argv[]) { • PIN_Init(argc, argv); • INS_AddInstrumentFunction(Instruction, 0); • PIN_AddFiniFunction(Fini, 0); • PIN_StartProgram(); • return 0; • } Instruction counting Pin Tool • #include <iostream> • #include "pin.H" • #include "instlib.H" • INSTLIB::ICOUNT icount; • VOID Fini(INT32 code, VOID *v) { • cout << "Count" << icount.Count() << endl; • } • int main(int argc, char * argv[]) { • PIN_Init(argc, argv); • PIN_AddFiniFunction(Fini, 0); • icount.Activate(); • PIN_StartProgram(); • return 0; • }
Useful InstLib abstractions • ICOUNT • # of instructions executed • FILTER • Instrument specific routines or libraries only • ALARM • Execution count timer for address, routines, etc. • FOLLOW_CHILD • Inject Pin into new process created by parent process • TIME_WARP • Preserves RDTSC behavior across executions • CONTROL • Limit instrumentation address ranges
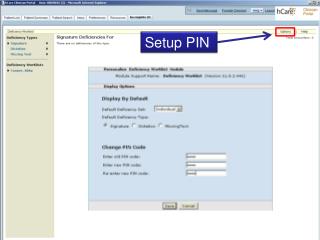
$ pin –pause_tool 5 –t inscount0 -- /bin/ls Pausing to attach to pid 32017 (gdb) attach 32017 (gdb) break main (gdb) cont Debugging Pintools • Invoke gdb with your pintool (don’t “run”) • In another window, start your pintool with the “-pause_tool” flag • Go back to gdb window: • Attach to the process • “cont” to continue execution; can set breakpoints as usual $ gdb inscount0 (gdb)
Pin Overhead • SPEC Integer 2006
Instrumentation Driven Simulation • Fast exploratory studies • Instrumentation ~= native execution • Simulation speeds at MIPS • Characterize complex applications • E.g. Oracle, Java, parallel data-mining apps • Simple to build instrumentation tools • Tools can feed simulation models in real time • Tools can gather instruction traces for later use
Performance Models • Branch Predictor Models: • PC of conditional instructions • Direction Predictor: Taken/not-taken information • Target Predictor: PC of target instruction if taken • Cache Models: • Thread ID (if multi-threaded workload) • Memory address • Size of memory operation • Type of memory operation (Read/Write) • Simple Timing Models: • Latency information
Branch Predictor Model API data Branch instr info Pin BPSim Pin Tool BP Model API() Instrumentation Tool Instrumentation Routines Analysis Routines • BPSim Pin Tool • Instruments all branches • Uses API to set up call backs to analysis routines • Branch Predictor Model: • Detailed branch predictor simulator
BP Implementation BranchPredictor myBPU; VOID ProcessBranch(ADDRINT PC, ADDRINT targetPC, bool BrTaken) { BP_Info pred = myBPU.GetPrediction( PC ); if( pred.Taken != BrTaken ) { // Direction Mispredicted } if( pred.predTarget != targetPC ) { // Target Mispredicted } myBPU.Update( PC, BrTaken, targetPC); } VOID Instruction(INS ins, VOID *v) { if( INS_IsDirectBranchOrCall(ins) || INS_HasFallThrough(ins) ) INS_InsertCall(ins, IPOINT_BEFORE, (AFUNPTR) ProcessBranch, ADDRINT, INS_Address(ins), IARG_UINT32, INS_DirectBranchOrCallTargetAddress(ins), IARG_BRANCH_TAKEN, IARG_END); } int main() { PIN_Init(); INS_AddInstrumentationFunction(Instruction, 0); PIN_StartProgram(); } ANALYSIS INSTRUMENT MAIN
Branch Predictor Performance - GCC Bimodal not chosen • Branch prediction accuracies range from 0-100% • Branches are hard to predict in some phases • Can simulate these regions alone by fast forwarding to them in real time Bimodal In McFarling Predictor McFarling Predictor
Performance Model Inputs • Branch Predictor Models: • PC of conditional instructions • Direction Predictor: Taken/not-taken information • Target Predictor: PC of target instruction if taken • Cache Models: • Thread ID (if multi-threaded workload) • Memory address • Size of memory operation • Type of memory operation (Read/Write) • Simple Timing Models: • Latency information
Cache Simulators API data Mem Addr info Pin Cache Pin Tool Cache Model API() Instrumentation Tool Instrumentation Routines Analysis Routines • Cache Pin Tool • Instruments all instructions that reference memory • Use API to set up call backs to analysis routines • Cache Model: • Detailed cache simulator
Cache Implementation CACHE_t CacheHierarchy[MAX_NUM_THREADS][MAX_NUM_LEVELS]; VOID MemRef(int tid, ADDRINT addrStart, int size, int type) { for(addr=addrStart; addr<(addrStart+size); addr+=LINE_SIZE) LookupHierarchy( tid, FIRST_LEVEL_CACHE, addr, type); } VOID LookupHierarchy(int tid, int level, ADDRINT addr, int accessType){ result = cacheHier[tid][cacheLevel]->Lookup(addr, accessType ); if( result == CACHE_MISS ) { if( level == LAST_LEVEL_CACHE ) return; LookupHierarchy(tid, level+1, addr, accessType); } } VOID Instruction(INS ins, VOID *v) { if( INS_IsMemoryRead(ins) ) INS_InsertCall(ins, IPOINT_BEFORE, (AFUNPTR) MemRef, IARG_THREAD_ID, IARG_MEMORYREAD_EA, IARG_MEMORYREAD_SIZE, IARG_UINT32, ACCESS_TYPE_LOAD, IARG_END); if( INS_IsMemoryWrite(ins) ) INS_InsertCall(ins, IPOINT_BEFORE, (AFUNPTR) MemRef, IARG_THREAD_ID, IARG_MEMORYWRITE_EA, IARG_MEMORYWRITE_SIZE, IARG_UINT32, ACCESS_TYPE_STORE, IARG_END); } int main() { PIN_Init(); INS_AddInstrumentationFunction(Instruction, 0); PIN_StartProgram(); } ANALYSIS INSTRUMENT MAIN
Performance Models • Branch Predictor Models: • PC of conditional instructions • Direction Predictor: Taken/not-taken information • Target Predictor: PC of target instruction if taken • Cache Models: • Thread ID (if multi-threaded workload) • Memory address • Size of memory operation • Type of memory operation (Read/Write) • Simple Timing Models: • Latency information
Simple Timing Model • Assume 1-stage pipeline • Ti cycles for instruction execution • Assume branch misprediction penalty • Tb cycles penalty for branch misprediction • Assume cache access & miss penalty • Tl cycles for demand reference to cache level l • Tm cycles for demand reference to memory • Total cycles = aTi + bTb + SAlTl+ hTm LLC l = 1 a = instruction count; b = # branch mispredicts ; Al = # accesses to cache level l ; h = # last level cache (LLC) misses
IPC L1 Miss Rate 2-way 32KB cumulative 10 mil phase L2 Miss Rate 4-way 256KB L3 Miss Rate 8-way 2MB Performance - GCC • Several phases of execution • Important to pick the correct phase of execution
IPC init repetitive L1 Miss Rate 2-way 32KB cumulative 10 mil phase L2 Miss Rate 4-way 256KB L3 Miss Rate 8-way 2MB Performance – AMMP • One loop (3 billion instructions) is representative • High miss rate at beginning; exploits locality at end
Knobs- Getting command arguments to your PIN tool • Example declarations: • KNOB<string> KnobOutputFile(KNOB_MODE_WRITEONCE, "pintool", "o", "dcache.out", "specify dcache file name"); • KNOB<BOOL> KnobTrackLoads(KNOB_MODE_WRITEONCE, "pintool", "l", "0", "track individual loads -- increases profiling time"); • KNOB<UINT32> KnobThresholdMiss(KNOB_MODE_WRITEONCE, "pintool", "m","100", "only report memops with miss count above threshold"); • -m # is the command flag to the pin tool • 100 is the default value • “only report…” usage of that parm
Knobs- Getting command arguments to your PIN tool • Example knob use: • TrackLoads= KnobTrackLoads.Value(); • if( TrackLoads ) • { • }