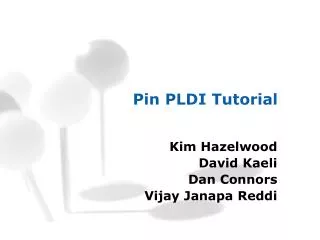
Pin Tutorial
Pin Tutorial. Kim Hazelwood Robert Muth VSSAD Group, Intel. Pin People. Robert Cohn Kim Hazelwood Artur Klauser Geoff Lowney CK Luk. Robert Muth Harish Patil Ramesh Peri Vijay Janapareddi Steven Wallace. Outline. Pin Overview Instrumentation Basics Advanced Topics. What is Pin?.

Pin Tutorial
E N D
Presentation Transcript
Pin Tutorial Kim Hazelwood Robert Muth VSSAD Group, Intel Pin2 Tutorial
Pin People Robert Cohn Kim Hazelwood Artur Klauser Geoff Lowney CK Luk Robert Muth Harish Patil Ramesh Peri Vijay Janapareddi Steven Wallace Pin2 Tutorial
Outline Pin Overview Instrumentation Basics Advanced Topics Pin2 Tutorial
What is Pin? • Pin Is Not a TLA • Pin is a dynamic binary rewriting engine • Derived from Spike: a static rewriter • Two versions available: • Pin2 is the current version • Pin0 (IPF only) is not covered in this talk Pin2 Tutorial
Pin Features • Rewritten program exists only in memory • No tool chain dependence • No issues with code/data mixing, missing relocs, etc. • Rewrites all user level code including shared libs • Multi-ISA: Itanium, IA32, EM64T, XScale • Attach/detach to/from running process (like gdb) • Transparent: unchanged program behavior • Efficient: very good performance Pin2 Tutorial
Pin Applications • Optimization • Security (program shepherding) • Debugging • Instrumentation Instrumentation is our current focus Pin2 Tutorial
Uses for Instrumentation • Profiling for optimization • Basic block counts, edge counts • Value profiles, stride profiling, load latencies • Micro-architectural studies • Branch predictor simulation • Cache simulation • Trace generation • Bug checking • Find uninitialized or unallocated data references Pin2 Tutorial
Pin Instrumentation Features • User programmable via plug-ins • many examples provided • plug-ins are typically ISA agnostic • Can take advantage of symtab info • Automatic register saving/restoring • Various instrumentation granularities • Instruction, “Trace”, Routine • ATOM compatibility mode (AOTI) Pin2 Tutorial
Other Dynamic Rewriting Engines(and what they focus on) • Dynamo (PA-RISC HPUX) • Dynamic optimization • DynamoRIO (IA32 Linux + Win32) • Originally: Dynamic optimization • Now: Sandboxing, some instrumentation • Valgrind (IA32 Linux) • Originally: Special-purpose instrumentation • Now: General-purpose instrumentation Pin2 Tutorial
Static Instrumentation(“Atom Style”) • (Way) Ahead-of-time • Persistent • Good but not perfect transparency • Shared libraries can be a problem Instrumented Program Program ATOM Pin2 Tutorial
Dynamic Instrumentation(“Pin Style”) • Execution driven • Occurs when code is executed • Original program is NOT modified • Code is “copied” into code cache • Only code in code cache is executed • Instrumentation is not persistent • Can also instrument libraries Pin2 Tutorial
1 2 3 4 5 6 7 Dynamic Instrumentation Original code Code cache Pin Pin has grabbed control before execution of block 1 Pin2 Tutorial
1 1’ 2 3 2’ 4 5 7’ 6 7 Dynamic Instrumentation Original code Code cache Pin Pin fetches trace and allows for instrumentation Pin2 Tutorial
1 1’ 2 3 2’ 4 5 7’ 6 Pin 7 Dynamic Instrumentation Original code Code cache Pin transfers control into code cache (block 1) Pin2 Tutorial
3’ 5’ 6’ Dynamic Instrumentation Original code Code cache 1 1’ 2 3 2’ 4 5 7’ 6 Pin 7 Pin fetches new trace and ‘links’ it Pin2 Tutorial
3’ 5’ 6’ Dynamic Instrumentation Original code Code cache 1 1’ 2 3 2’ 4 5 7’ 6 Pin 7 Pin transfers control into code cache (block 3) Pin2 Tutorial
Running Pin • Three program images are involved: • pin • pintool/plug-in • Application • “Shell mode” $ pin –t inscount –- xclock • “Gdb mode” - attaching to existing process $ pin –pid 1067 –t inscount (can detach and re-attach with different plug-in) Pin2 Tutorial
Transparency Program execution under Pin is transparent: • Program state is unchanged • Code/data addresses, memory content • Will not expose latent bugs • Instrumentation sees the original program • Code/data address, memory content • (But: intentional program state changes possible, e.g. fault injection) Pin2 Tutorial
Transparency (Example) Original Code: 0x1000 call 0x4000 Code cache address mapping: 0x1000 ->0x7000 “caller” 0x4000 -> 0x8000 “callee” Translated Code: 0x7000 Push 0x1006 0x7006 Jmp 0x8000 Push 0x1006 on stack, then jump to 0x4000 Stack content remains unchanged Pin2 Tutorial
Transparency has a Price Original Code: 0x4400 ret Translated Code: 0x8400 Pop rx 0x84… ry = Translate(rx) 0x84… Jmp ry Pop 0x1006 from stack, then jump to 0x1006 • Pin needs to translate program address to code cache address. • Main reason for slowdowns in dynamic instrumentation systems! Pin2 Tutorial
Portability Challenges Pin2 Tutorial
Pin Instrumentation Query API • ISA independent part (usually sufficient) • INS_Address(), INS_Size(), INS_IsRet(), INS_IsCall(), INS_MemoryReadSize(), INS_Mnemonic(), etc. • ISA dependent part (optional) • INS_GetPredicate(), INS_RegR(), INS_RegW(), etc. Pin2 Tutorial
Performance Comparison:No Instrumentation C latest numbers are even better Pin2 Tutorial
Performance Comparison: Basic-Block Counting C latest numbers are even better Pin2 Tutorial
Pin2 Status • ISAs: IA32, IA32E, Xscale, (IPF soon) • Distros: Debian, Suse, Mandrake, Red Hat 7.2, 8.0, 9.0, EL3, FC3 • >2500 downloads • Multithreading support in beta • Windows support in preparation Pin2 Tutorial
Project Engineering • Automatic nightly testing • >4 platforms • >7 Linux distributions • >8 compilers • >9000 binaries • Automatically generated user manual, internal documentation using Doxygen Pin2 Tutorial
Outline Pin Overview Instrumentation Basics Advanced Topics Pin2 Tutorial
Instrumentation vs. Analysis Concepts borrowed from ATOM • Instrumentation routines define where instrumentation is inserted • e.g. before instruction Occurs at compile time (JIT time) • Analysis routines define what to do when instrumentation is activated • e.g. increment counter Occurs at runtime Pin2 Tutorial
Instrumentation vs. Analysis (2) In ATOM: • Instrumentation and analysis occurred in separate phase • Code was in separate files In Pin: • Difference is somewhat blurred • Instrumentation and analysis are interleaved • User plug-in provides code for both These are difficult terms to remember! Mental Bridge: Instrumentation → Insertion Analysis → Action Pin2 Tutorial
Instrumentation Routine • Written in C++ • Invoked by Pin via Callback mechanism • Invoked when Pin places new code in code cache (different granularities: instruction, trace, …) • Instruments using the Pin API for • inserting calls to analysis routines • picking arguments for analysis routines Pin2 Tutorial
Analysis Routines • Written in any language: C, C++, Asm, etc. • Invoked when surrounding code executes • Isolated from application by • separate memory areas • separate register state • Automatically optimized by Pin (inlining, register allocation, etc.) Pin2 Tutorial
IncCounter(); IncCounter(); IncCounter(); IncCounter(); IncCounter(); Example: Instruction Count mov r2 = 2 add r3 = 4, r3 beq L1 add r4 = 8, r4 beq L2 Instrumentation: Insert call to IncCounter() before every instruction Analysis: VOID IncCounter() { icount++; } Pin2 Tutorial
Example: Instruction Count $ /bin/ls Makefile atrace.o imageload.out $ pin -t inscount -- /bin/ls Makefile atrace.o imageload.out Count 422838 $ Output of inscount plug-in Pin2 Tutorial
#include <iostream> #include "pin.H" UINT64 icount = 0; VOID IncCounter() { icount++; } VOID Instruction(INS ins, VOID *v) { INS_InsertCall(ins, IPOINT_BEFORE, (AFUNPTR)IncCounter, IARG_END); } VOID Fini(INT32 code, VOID *v) { std::cerr << "Count " << icount << endl; } int main(int argc, char * argv[]) { PIN_Init(argc, argv); INS_AddInstrumentFunction(Instruction, 0); PIN_AddFiniFunction(Fini, 0); PIN_StartProgram(); return 0; } inscount.C analysis 2 instrumentation 1 driver 3 Pin2 Tutorial ISA independent!
Explanations • Register Instruction() to be called back for every instruction placed into the code cache • Insert call to IncCount() before code cache instruction • Register Fini() to be called back at the end Pin2 Tutorial
Instrumentation Points Relative to an instruction (“beq L2”): • Before (IPOINT_BEFORE) • After (IPOINT_AFTER) • On taken branch (IPOINT_BRANCH_TAKEN) mov r4 = 2 L2: mov r9 = 4 ret 3 1 beq L2 2 add r3=8,r9 Pin2 Tutorial
traceInst(ip); traceInst(ip); traceInst(ip); traceInst(ip); traceInst(ip); Example: Instruction Trace mov r2 = 2 add r3 = 4, r3 beq L1 add r4 = 8, r4 beq L2 Pin2 Tutorial
Example: Instruction Trace $ pin -t itrace -- /bin/ls Makefile atrace.o imageload.out $ head itrace.out 0x40001e90 0x40001e91 0x40001ee4 0x40001ee5 0x40001ee7 0x40001ee8 … $ Pin2 Tutorial
itrace.C #include <stdio.h> #include "pin.H" FILE * trace; VOID traceInst(VOID *ip) { fprintf(trace, "%p\n", ip); } VOID Instruction(INS ins, VOID *v) { INS_InsertCall(ins, IPOINT_BEFORE, (AFUNPTR)traceInst, IARG_INST_PTR, IARG_END); } int main(int argc, char * argv[]) { trace = fopen("itrace.out", "w"); PIN_Init(argc, argv); INS_AddInstrumentFunction(Instruction, 0); PIN_StartProgram(); return 0; } 1 Pin2 Tutorial
Explanations • Insert traceIns() before code cache instruction, traceIns() takes extra argument! (Bad coding practice: we should have closed the file descriptor using a Fini function) Pin2 Tutorial
Analysis Routine Parameters • IARG_UINT32 <number> • IARG_REG_VALUE <register name> [*] • IARG_INST_PTR • IARG_BRANCH_TAKEN • IARG_BRANCH_TARGET_ADDR • IARG_G_ARG0_CALLER • IARG_MEMORY_READ_EA • IARG_SYSCALL_NUMBER • … [*] Will result in ISA dependent tool Pin2 Tutorial
IncCounter(1); IncCounter(3); IncCounter(1); BBL1 IncCounter(1); IncCounter(1); IncCounter(2); BBL2 IncCounter(1); Example: Fast Instruction Count mov r2 = 2 add r3 = 4, r3 beq L1 add r4 = 8, r4 beq L2 Pin2 Tutorial
inscount.C #include <stdio.h> #include "pin.H“ UINT64 icount = 0; VOID IncCounter(INT32 c) { icount += c; } VOID Trace(TRACE trace, VOID *v) { for(BBL b=TRACE_BblHead(trace); BBL_Valid(b); b=BBL_Next(b)){ BBL_InsertCall(b, IPOINT_BEFORE, (AFUNPTR)IncCounter, IARG_UINT32, BBL_NumIns(b), IARG_END); } } VOID Fini(INT32 code, VOID *v) { fprintf(stderr, "Count %lld\n", icount);} int main(int argc, char * argv[]) { PIN_Init(argc, argv); TRACE_AddInstrumentFunction(Trace, 0); PIN_AddFiniFunction(Fini, 0); PIN_StartProgram(); return 0; } 2 1 Pin2 Tutorial
Explanations 1. Register Trace() to be called back for every trace placed in the code cache As first approximation, a “trace” is sequence of basic blocks (BBLs) 2. For each trace walk the BBLs and insert IncCount() with appropriate integer parameter at beginning Pin2 Tutorial
Further Reading The following material is also covered in the Pin user manual Go to http://rogue.colorado.edu/Pin/ Then follow the “manuals” link Pin2 Tutorial
Summary • Pin instrumentation is: • Robust • Transparent • Easy-to-use • Efficient • Portable • Try it: http://rogue.colorado.edu/Pin Pin2 Tutorial
Outline Pin Overview Instrumentation Basics Advanced Topics Pin2 Tutorial
Trace vs. Instruction Instrumentation VOID Instruction(INS ins, VOID *v) { INS_InsertCall(ins, IPOINT_BEFORE,(AFUNPTR)Cnt, IARG_END); } Can be emulated by: VOID Trace(TRACE trace, VOID *v) { for (BBL bbl = TRACE_BblHead(trace); BBL_Valid(bbl); bbl = BBL_Next(bbl)) { for ( INS ins = BBL_InsHead(bbl); INS_Valid(ins); ins = INS_Next(ins)){ INS_InsertCall(ins,IPOINT_BEFORE,(AFUNPTR)Cnt,IARG_END); } } } Pin2 Tutorial
Definition: Pin Trace (JITI) • List of instructions that is only entered from top, but may have multiple exits • No side entries (Pin duplicates code to ensure this!) • Multiple copies of instruction in code cache Program: mov r2 = 2 L2: add r3 = 4, r3 add r4 = 8, r4 beq L2 … Trace 1: mov r2 = 2 add r3 = 4, r3 add r4 = 8, r4 beq L2 … Trace 2: add r3 = 4, r3 add r4 = 8, r4 beq L2 … Pin2 Tutorial
Instrumentation Modes • Just-In-Time Instrumentation (JITI) • Per instruction, per trace • “basic block” notion • Ahead-Of-Time Instrumentation (AOTI) • Per instruction, per function, per section/image • Emulated using JITI • Functionality similar to ATOM • Extra startup overhead • No “basic blocks” notion Pin2 Tutorial