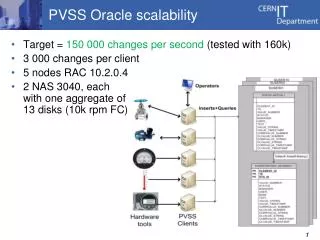
PVSS Oracle scalability
PVSS Oracle scalability. Target = 150 000 changes per second (tested with 160k) 3 000 changes per client 5 nodes RAC 10.2.0.4 2 NAS 3040, each with one aggregate of 13 disks (10k rpm FC). PVSS Tuning (1/6). Table event lastval. trigger on update eventlast … merge (…).

PVSS Oracle scalability
E N D
Presentation Transcript
PVSS Oracle scalability • Target = 150 000 changes per second (tested with 160k) • 3 000 changes per client • 5 nodes RAC 10.2.0.4 • 2 NAS 3040, each with one aggregate of 13 disks (10k rpm FC) 1
PVSS Tuning (1/6) Table event lastval trigger on update eventlast … merge (…) • Shared resource: EVENTS_HISTORY (ELEMENT_ID, VALUE…) • Each client “measures” input and registers history with a “merge” operation in the EVENTS_HISTORY table Performance: • 100 “changes” per second Update eventlastval set … Table events_ history Update eventlastval set … 150 Clients DB Servers Storage 2
PVSS Tuning (2/6) Initial state observation: • database is waiting on the clients “SQL*Net message from client” • Use of a generic library C++/DB • Individual insert (one statement per entry) • Update of a table which keeps “latest state” through a trigger 3
PVSS Tuning (3/6) Changes: • bulk insert to a temporary table with OCCI, then call PL/SQL to load data into history table Performance: • 2000 changes per second Now top event: “db file sequential read” awrrpt_1_5489_5490.html UKOUG Conference 2007 - 4
PVSS Tuning (4/6) Changes: • Index usage analysis and reduction • Table structure changes. IOT. • Replacement of merge by insert. • Use of “direct path load” with ETL Performance: • 16 000 “changes” per second • Now top event: cluster related wait event test5_rac_node1_8709_8710.html 5
PVSS Tuning (5/6) Changes: • Each “client” receives a unique number. • Partitioned table. • Use of “direct path load” to the partition with ETL Performance: • 150 000 changes per second • Now top event : “freezes” once upon a while rate75000_awrrpt_2_872_873.html UKOUG Conference 2007 - 6
PVSS Tuning (6/6) Problem investigation: • Link between foreground process and ASM processes • Difficult to interpret ASH report, 10046 trace Problem identification: • ASM space allocation is blocking some operations Changes: • Space pre-allocation, background task. Result: • Stable 150 000 “changes” per second. 7
PVSS Tuning Schema Table event lastval trigger on update eventlast … merge (…) Update eventlastval set … Update eventlastval set … Table events_ history 150 Clients DB Servers Storage PL/SQL: insert /*+ APPEND */into eventh (…) partition PARTITION (1)select …from temp Bulk insert into temp table Temp table Table events_ history Bulk insert into temp table 8
PVSS Tuning Summary Conclusion: • from 100 changes per second to 150 000 “changes” per second • 6 nodes RAC (dual CPU, 4GB RAM), 32 disks SATA with FCP link to host • 4 months effort: • Re-writing of part of the application with changes interface (C++ code) • Changes of the database code (PL/SQL) • Schema change • Numerous work sessions, joint work with other CERN IT groups 9
The Tuning Process 1. run the workload, gather ASH/AWR information, 10046… 2. find the top event that slows down the processing 4. modify client code, database schema, database code, hardware configuration 3. understand why time is spent on this event 10
Demo Single.java TanelPoder’ssnapper.sql Disable autocommit TanelPoder’ssnapper.sql Batch.java DEMO 11
* 2.45 * 267 12
The Tuning Process 1. run the workload, gather ASH/AWR information, 10046… 2. find the top event that slows down the processing 4. modify client code, database schema, database code, hardware configuration 3. understand why time is spent on this event 13