Scalability
Scalability. Optimizing P2P Networks: Lessons learned from social networking Social Networks Lessons Learned Are P2P Networks Social?? Organizing P2P Networks Peer Topologies Centralized, Ring, Hierarchical & Decentralized Hybrid: Centralized-Ring Centralized-Centralized

Scalability
E N D
Presentation Transcript
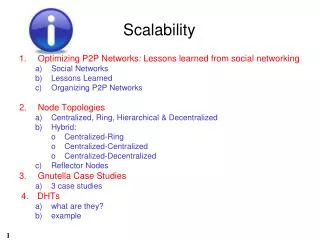
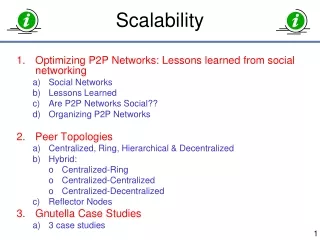
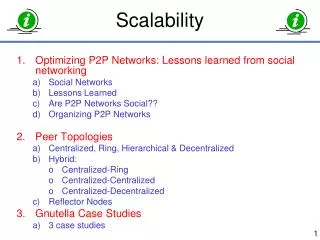
Scalability • Optimizing P2P Networks: Lessons learned from social networking • Social Networks • Lessons Learned • Are P2P Networks Social?? • Organizing P2P Networks • Peer Topologies • Centralized, Ring, Hierarchical & Decentralized • Hybrid: • Centralized-Ring • Centralized-Centralized • Centralized-Decentralized • Reflector Nodes • Gnutella Case Studies • 3 case studies 1
Scalability “You can’t scale better than by utilising someone else’s computer.” • Paul James1 2
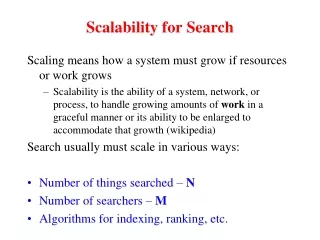
Social Networks Boston Omaha • Stanley Milgram (Harvard professor) – 1967 social networking experiment • How many ‘social hops’ would it take for messages to traverse through the US population (200 million) • Posted 160 letters randomly chosen people in Omaha, Nebraska • Asked them to try to pass these letters to a stockbroker working in Boston, Massachusetts • Rules: • use intermediacies whom they know on a first name basis • chosen intelligently • make a note at each hop • 42 letters made it !! • Average of 5.5 hops • Demonstrated the ‘small world effect’ Proved that the social network of the United States is indeed connected with a path-length (number of hops) of around 6 – The 6 degrees of separation ! 4 Does this mean that it takes 6 hops to traverse 200 million people??
Lessons Learned from Milgrim’s Experiment • Social circles are highly clustered • A few members have wide-ranging connections • these form a bridge between far-flung social clusters • this bridging plays a critical role in bringing the network closer together • For example • A quarter of all letters passed through a local storekeeper • A half were mediated by just 3 people • Lessons Learned • These people acted as gateways or hubs between the source and the wider world • A small number of bridges dramatically reduces the number of hops 5
From Social Networks toComputer Networks… • There are a number of similarities to social networks • People = peers • Intermediaries = Hubs, Gateways or Rendezvous Nodes (JXTA speak...) • Number of intermediaries passed through = number of hops • Are P2P Networks Special then? • P2P networks are more like social networks than other types of computer network because they are often: • Self Organizing • Ad-Hoc • Employ clustering techniques based on prior interactions (like we form relationships) • Decentralized discovery and communication (like we form neighbourhoods, villages, cities etc)
Peer to Peer: What’s the problem? • Problem: how do we organize peers within ad-hoc, multi-hop pervasiveP2P networks? • network of self-organizing peers organized in a decentralized fashion • such networks can rapidly expand from a few hundred peers to several thousand or even millions • P2P Environment Recap: • Unreliable Environments • Peers connecting/disconnecting – network failures to participation • Random Failures e.g. power outages, Cable, DSL failure, hackers • Personal machines are much more vulnerable than servers • algorithms have to cope with this continuous restructuring of the network core. • P2P systems need to treat failures as normal occurrences not freak exceptions • must be designed in a way that promotes redundancy with the tradeoff of a degradation of performance
So, how do we Organize Networks inOrder to Get Optimum Performance? • For P2P • This does not mean abstract numerical benchmarks e.g. how many milliseconds will it take to compute this many millions of FFTs? • Rather, it means asking question like: • How long will it take to retrieve this particular file? • How much bandwidth will this query consume? • How many hops will it take for my package to get to a peer on the far side of the network? • If I add/remove a peer to the network will the network still be fault tolerant? • Does the network scale as we add more peers. Such networks can rapidly expand from a few hundred peers to several thousand or even millions
Performance Issues in P2P Networks 3 main factors that make P2P networks more sensitive to performance issues: • Communication. • Fundamental necessity • Users connected via different connections speeds • Multi-hop • 2.Searching • No central Control so more effort is needed • Each hop adds to total bandwidth – problems: time outs • 3.Equal Peers • Free Riders – unbalance in the harmonicity of network • Degrades performance for others • Need to get this right to adjust accordingly 9
Peer Topologies • Core • Centralized • Ring • Hierarchical • Decentralized • Hybrid • Centralized-Ring • Centralized-Centralized • Centralized-Decentralized 10
Centralized • Client/server • Web servers • Databases • Napster search • Instant Messaging • Popular Power 11
Ring • Fail-over clusters • Simple load balancing • Assumption • Single owner 12
Hierarchical • Tree structure • DNS • Usenet (sort of) 13
Decentralized • Gnutella • Freenet • Internet routing
Centralized + Ring • Robust web applications • High availability of servers 15
Centralized + Centralized • N-tier apps • Database heavy systems • Web services gateways • Google.com uses this topology to deliver their service
Centralized + Decentralized • New Wave of P2P • Clip2 Gnutella Reflector (next) • FastTrack • KaZaA • Morpheus • Email • Like Social Networks perhaps ? 17
Reflector Nodes C F1.mp3 0 F1.mp3 – ID0:F1.mp3 … F2.mp3 1 F3.mp3 2 • Known as ‘super peers’ – in JXTA these are Rendezvous peers • cache file list of connected users – maintain an index • When a query is issued, the Reflector does not retransmit it - it answers the query from its own memory • Do they remind you of anything ? 18
Napster = Gnutella? N3 User N2 Napster Gnutella Super Peers: Napster Duplicated Servers Gnutella Napster User Napster.com =? 1. Natural?? 2. Reflector (clip2.com) 19
The Gnutella Network Today The figure below is a view of the topology of a Gnutella network as shown on the LimeWire web site, the popular Gnutella file-sharing client. Notice how the power-law or centralized-decentralized structure is demonstrated. 20
Gnutella Studies 1: Free Riding E. Adar and B.A. Huberman (2000), “Free Riding on Gnutella,” First Monday 5(10), http://firstmonday.org/issues/issue5_10/adar/index.html Two types of free riding • download files but never provide any files for other to download • users that have undesirable content • They found 22,084 of the 33,335 peers in the network (66%) of the peers share no files • 24,347 or 73% share ten or less files • top 1 percent (333 hosts) represent 37 percent of the total files shared • 20 percent (6,667 hosts) sharing 98% of the files shows - even without Gnutella Reflector nodes, the Gnutella network naturally converges into a centralized + decentralized topology with the top 20% of nodes acting as super peers or reflectors 22
Gnutella Studies 2: Equal Peers Study on Reflector Nodes [clip] www.clip2.com Studied Gnutella for one month • Noted an apparent scalability barrier when query rates went above 10 per second. Why?? • Gnutella query = 560 bits long and queries make up approximately one quarter of traffic. • Each peer is connect to three peers, so: 560 *10 * 3 = 16,800 bytes per second • This is a quarter of the traffic so total traffic 67,200 bytes per second. • a 56-K link cannot keep up with this amount of traffic • one node connected in the incorrect place can grind the whole network to a halt. • This is why P2P networks place slower nodes at the edges 23
Gnutella Studies 3: Communication Peer-to-Peer Architecture Case Study: Gnutella Network MateiRipeanu, on-line at: http://people.cs.uchicago.edu/~matei/PAPERS/P2P2001.pdf Studied topology of Gnutella over several months & reported two findings: • Gnutella network shares the benefits and drawbacks of a power-law structure • - networks that organize themselves so that most nodes have a few links and a small number of nodes have many • - found to show an unexpected degree of robustness when facing random node failures. • - vulnerable to attacks e.g. by removing a few of the super nodes can have a massive effect on the function of the network as a whole. • Gnutella network topology does not match well with the underlying Internet topology leading to inefficient use of network bandwidth. • He gave 2 suggestions: • use an agent to monitor network and intervene by asking serventsto drop/add links to keep the topology optimal. • replace the Gnutella flooding mechanism with a smarter routing and group communication mechanism. 24
What about other topologies: The Future? • Centralized + Hierarchical? • Back end tree of information • Caching architectures • Decentralized + Ring? • P2P network of fail-over clusters • More ?? 25
Closing Remarks • Summary • Centralized + Decentralized – understand from the original Gnutella to the new models • The role of Reflector nodes • Further Information: Distributed Hashtable Models • Pastry: http://research.microsoft.com/~antr/pastry • Chord: http://www.pdos.lcs.mit.edu/chord/ 26