Download
1 / 28
310 likes | 1.47k Vues
Financial Analysis 2.1 Scope and Purpose 2.2 Financial Statements 2.3 Horizontal Analysis 2.4 Vertical Analysis 2.5 Ratio Analysis 2.6 Limitations of Ratios 2.7 Changes in Cash 2.8 Statement of Cash Flows Financial Analysis

E N D
Financial Analysis 2.1 Scope and Purpose 2.2 Financial Statements 2.3 Horizontal Analysis 2.4 Vertical Analysis 2.5 Ratio Analysis 2.6 Limitations of Ratios 2.7 Changes in Cash 2.8 Statement of Cash Flows Professor James Kuhle
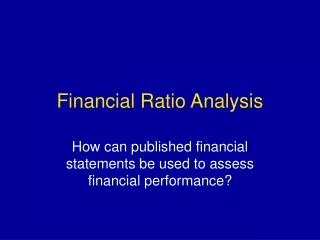
Financial Analysis • Financial analysis is an evaluation of both a firm’s past financial performance and its prospects for the future. • Financial statement analysis involves the calculation of various ratios from the financial statements. • Funds flow Analysis is an evaluation of the firm’s statement of cash flows in order to determine the impact that its sources and uses of funds have on the firm’s operations and financial condition. Professor James Kuhle
Financial Analysis • Industry Comparison: Here the ratios of the firm are compared with those of similar firms or norms. • Dun and Bradstreet • Robert Morris and Associates • Trend Analysis: Here a firm’s present ratio is compared with its past and expected future ratios to determine whether the company’s financial condition is improving or deteriorating over time. • Horizontal Analysis: this is used to evaluate the trend in the ratios over time. Professor James Kuhle
Cash Marketable Securities Accounts Receivable Inventory Total Current Assets Investments Plant & Equipment Less: Accumulated Dep. TOTAL ASSETS Accounts Payable Notes Payable Accrued Expenses Total Current Liabilities Bonds Payable Total Liabilities Preferred Stock Common Stock Paid-in-Capital Retained Earnings Total Stockholders’ Equity TOTAL LIABILITIES & EQUITY BALANCE SHEET Statement of Financial Position 12/31/04 Professor James Kuhle
BALANCE SHEET(Continued) • Current Assets: Can or will be used up during the next accounting cycle (normally - one year). • Current Liabilities: Short-term obligations to creditors. • Preferred Stock: A hybrid security (Will discuss later). • Common Equity: Common Stock Paid-in-Capital Retained Earnings (i.e., All equity except preferred stock) Professor James Kuhle
INCOME STATEMENT(For the Year Ended 12/31/04) Sales (Cost of Goods Sold) Gross Profit (Depreciation) (Other Operating Expenses) Operating Profit (EBIT) (Interest) Earnings Before Taxes (EBT) (Taxes) Earnings After Taxes (EAT) (Preferred Dividends) Earnings Available to Common Shareholder (EAC) Professor James Kuhle
INCOME STATEMENTContinued • Note: Dividends are a distribution of after-tax income. • EAC is available for common dividends or retained earnings. • Earnings Per Share (EPS): EPS = (EAC)/(Number of Common Shares) • Price Per Share: Price = (EPS)(P/E Ratio) Professor James Kuhle
The Ratio Company Income Statement Common Size Analysis AmountPercentage Total Sales $100 125% -Less Sales Return& Allow. -2025% Net Sales $80 100 - GOGS 50 62.5 Gross Profit $30 37.5 - Selling Expense $11 13.8 - General Expenses $ 45.0 Income From Operations $15 18.8 Other Income $ 3 3.8 EBIT $1822.5 - Interest Expense $ 2 2.5 Income Before Taxes $16 20.0 - Income Taxes $6.4 8.0 Net Income $9.612.0 Professor James Kuhle
Groups of Financial Ratios • Liquidity = • Activity • Debt • Profitability Professor James Kuhle
Analyzing Liquidity • Liquidity refers to the solvency of the firm's overall financial position, i.e. a "liquid firm" is one that can easily meet its short-term obligations as they come due Professor James Kuhle
Three Liquidity Measures Net Working Capital (NWC) NWC = Current Assets - Current Liabilities Current Ratio (CR) Current Assets CR = Current Liabilities Quick (Acid-Test) Ratio (QR) Current Assets - Inventory QR = Current Liabilities Professor James Kuhle
Analyzing Activity Analyzing Activity • Activity is a more sophisticated analysis of a firm's liquidity, evaluating the speed with which certain accounts are converted into sales or cash; also measures a firm's efficiency Professor James Kuhle
Five Important Activity Measures • Cost of Goods Sold • IT = • Inventory • Accounts Receivable • ACP = • Annual Sales/360 • Accounts Payable • APP= • Annual Purchases/360 • Sales • FAT = • Net Fixed Assets • Sales • TAT = • Total Assets Inventory Turnover (IT) Average Collection Period (ACP) Average Payment Period (APP) Fixed Asset Turnover (FAT) Total Asset Turnover (TAT) Professor James Kuhle
The Operating Cycle • The operating cycle of a business is the number of days it takes to convert inventory and receivables to cash. Hence, a short operating cycle is desirable. Operating Cycle = ACP + AAI The Operating Cycle of the Ratio Company is: 79.9 + 347.6 = 427.5 days Professor James Kuhle
Interrelationship of Liquidity and Activity to Earnings A trade-off exists between liquidity, risk, and return. Liquidity risk is minimized by holding greater current assets than non-current assets. However, the rate of return will decline because the return on CA is less that the rate on fixed assets. High liquidity may also mean that management has not found desirable capital investment opportunities. Also, high profitability does not necessarily infer a strong cash flow position. Income may be high but cash problems may exist because of maturing debt and the need to replace assets. Professor James Kuhle
Analyzing Debt • Debt is a true "double-edged" sword as it allows for the generation of profits with the use of other people's (creditors) money, but creates claims on earnings with a higher priority than those of the firm's owners • Financial Leverage is a term for the magnification of risk and return resulting from the use of fixed-cost financing such as debt and preferred stock Professor James Kuhle
Measuring Debt • There are Two General Types of Debt Measures: 1. Degree of Indebtedness 2. Ability to Service Debts Professor James Kuhle
Four Important Debt Measures Debt Ratio (DR) Debt-Equity Ratio (DER) Times Interest Earned Ratio (TIE) • Total Liabilities • DR= • Total Assets • Long-Term Debt • DER = • Stockholders’ Equity • Earnings Before Interest • TIE = & Taxes (EBIT) • Interest Professor James Kuhle
Analyzing Profitability • Profitability Measures assess the firm's ability to operate efficiently and are of concern to owners, creditors, and management • A Common-Size Income Statement, which expresses each income statement item as a percentage of sales, allows for easy evaluation of the firm’s profitability relative to sales. Professor James Kuhle
Seven Basic Profitability Measures • Gross Profits • GPM= • Sales • Operating Profits (EBIT) • OPM = • Sales • Net Profit After Taxes • NPM= • Sales • Net Profit After Taxes • ROA= • Total Assets • Net Profit After Taxes • ROE= • Stockholders’ Equity • Earnings Available for • Common Stockholder’s • EPS = • Number of Shares of Common • Stock Outstanding • Market Price Per Share of • Common Stock • P/E = • Earnings Per Share Gross Profit Margin (GPM) Operating Profit Margin (OPM) Net Profit Margin (NPM) Return on Total Assets (ROA) Return On Equity (ROE) Earnings Per Share (EPS) Price/Earnings (P/E) Ratio Professor James Kuhle
Summary and Limitations of Ratio Analysis: 1. Many large firms have multiple businesses, it then becomes difficult to identify the industry group to which the firm belongs. 2. Operating and accounting practices differ from firm to firm, which can distort the ratios. 3. Published industry average ratios are only approximations. 4. Financial statements don’t take into account inflation. 5. Management may fudge figures. 6. A ratio does not describe the quality of it’s components 7. Ratios are static and do not consider future trends. Professor James Kuhle
DuPont Analysis • DuPont System of Analysis • The DuPont System of Analysis is an integrative approach used to dissect a firm's financial statements and assess its financial condition • It ties together the income statement and balance sheet to determine two summary measures of profitability, namely ROA and ROE Professor James Kuhle
Review Questions to Contemplate • Comparing an account to the same account in a prior year is known as horizontal (or time series) analysis. • In a common size income statement, net sales is given the value of 100%. • The number of days it takes to convert inventory sold on credit into cash comes from adding the collection period to the average age of inventory. • The ratio of total liabilities to stockholders equity is called the debt to equity ratio. • Return on equity is found by dividing net earnings by total equity. • Other names for net income are: net operating profits after tax; net income available to the common shareholder; net operating income. • The P/E ratio is equal to the price per share divided by the earnings per share. • Depreciation expense is one item that must be added back to net income to determine the cash flow from operations. • According to the Dupont analysis, the return on equity is the return on total assets multiplied by the equity multiplier. Professor James Kuhle
Review Questions to Contemplate 10. Comparing an account to the same account in a prior year is known astime series (horizontal analysis). • Inventory is included in computing the current ratio but not the quick ratio. • Two measures that are of interest to shareholder in evaluating the dividend policy of a firm are dividend yield and dividend payout. • The primary concern of creditors when assessing the strength of a firm is the firm’sshort-term liquidity. • One way to correct for the effect of inflation on ratio analysis is to value the fixed assets atreplacement value. • Net working capital is defined asthe excess of current assets over current liabilities. • The three basic measures of liquidity are Current ratio, quick ratio, and net working capital. Professor James Kuhle