Download
1 / 54
570 likes | 1.42k Vues
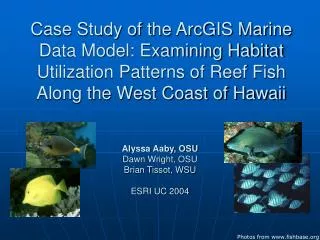
Case Study of the ArcGIS Marine Data Model: Examining Habitat Utilization Patterns of Reef Fish Along the West Coast of Hawaii Alyssa Aaby, OSU Dawn Wright, OSU Brian Tissot, WSU ESRI UC 2004 Photos from www.fishbase.org Outline Background Part 1: The ArcGIS Marine Data Model (MDM)

E N D
Case Study of the ArcGIS Marine Data Model: Examining Habitat Utilization Patterns of Reef Fish Along the West Coast of Hawaii Alyssa Aaby, OSU Dawn Wright, OSU Brian Tissot, WSU ESRI UC 2004 Photos from www.fishbase.org
Outline • Background • Part 1: The ArcGIS Marine Data Model (MDM) • Research Questions • Methods • Results • Part 2: Habitat Analysis • Research Questions • Methods • Results • Discussion and Conclusion
Marine Resource Management • Marine resources are at risk (eg. Leslie et al., 2003, Mumby et al., 2001, Puniwai et al., 2003) • Growing interest in Marine Protected Areas (MPAs) • Management tool • Effective both ecologically and economically (eg. Carr et al., 2003, Friedlander and Brown, 2003, Tissot et al., 2004)
Marine Resource Management • How can we make MPAs as effective as possible? • Identify areas with patterns of high habitat utilization
Two Main Questions • Question 1: What is the habitat utilization of specific fish species at a coarse-scale?
Two Main Questions • Question 1: What is the habitat utilization of specific fish species at a coarse-scale? • To answer question, use ArcGIS MDM
Two Main Questions • Question 1: What is the habitat utilization of specific fish species at a coarse-scale? • To answer question, use ArcGIS MDM • Use real data to test model itself
Two Main Questions • Question 1: What is the habitat utilization of specific fish species at a coarse-scale? • To answer question, use ArcGIS MDM • Use real data to test model itself • Question 2: How well does the MDM meet the needs of the marine GIS community?
Conceptualizing the MDM • Building industry-specific data models for ArcGIS • In 2001, researchers decided to create a model specifically for the marine community • The ArcGIS Marine Data Model
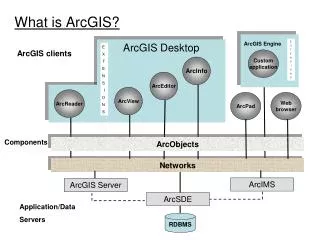
What is the MDM? • A geodatabase template • A new way to spatially model marine data • A database used to assemble, store and query data • Model that captures the behavior of real-world objects
Why use the MDM? • Standardized template • Implement project • Organize data • GIS and data management • Easy to share • Build upon • Querying ability • Object orientation
Outline • Background • Part 1: The Marine Data Model (MDM) • Research Questions • Methods • Results • Part 2: Habitat Analysis • Research Questions • Methods • Results • Discussion and Conclusion
Testing the ArcGIS Marine Data Model: 3 Goals Case study tested 3 goals (Wright et al, 2002): Goal 1: Assembling, managing, and querying in ArcGIS Goal 2: Provide a template Goal 3: Improve the understanding of geodatabase models
Outline • Background • Part 1: The Marine Data Model (MDM) • Research Questions • Methods • Results • Part 2: Habitat Analysis • Research Questions • Methods • Results • Discussion and Conclusion
Methodology • Goals 1 and 2: • Data Gathered • Formatting • Importing • Querying • Goal 3 • Tutorial created
Data Gathered • West Hawaii Aquarium Project (WHAP) (Tissot et al., 2004) • Coral Reef Assessment and Monitoring Program (CRAMP) (Brown et al., 2004) • State of Hawaii’s Division of Aquatic Resources (DAR) (DAR, 2004) • Saving Maui’s Reefs project (Brown, 1998) • Individual peer-reviewed journal articles • Date, sites, method, frequency, info
Formatting: Getting Data into the MDM Formatting data to fit MDM template Portion of MDM MS Access http://dusk.geo.orst.edu/djl/arcgis/diag.html
Can add new fields Importing: Personalizing the MDM • Adding fields to the feature classes, tables • Adding new tables and relationships • Attention to detail required • Worth it in the end!
Goal 3: Improve Understanding of Geodatabase Model • Benefits of MDM • The MDM Tutorial • Response
Outline • Background • Part 1: The Marine Data Model (MDM) • Research Questions • Methods • Results • Part 2: Habitat Analysis • Research Questions • Methods • Results • Discussion and Conclusion
Outline • Background • Part 1: The Marine Data Model (MDM) • Research Questions • Methods • Results • Part 2: Habitat Analysis • Research Questions • Methods • Results • Discussion and Conclusion
Habitat Utilization • What is the habitat utilization pattern of selected fish species at a coarse-scale? • Can fine-scale substrate info be correlated to coarse-scale habitat info? • Does depth play a role in the location of coarse-scale habitat types?
Outline • Background • Part 1: The Marine Data Model (MDM) • Research Questions • Methods • Results • Part 2: Habitat Analysis • Research Questions • Methods • Results • Discussion and Conclusion
Fish Analysis done with MDM • Select WHAP data • Determined site location in each habitat type and zone
Sites classified by Habitat and Zone Zone: All sites with data were located in the shelf zone, with the exception of Puako which was located in the fore-reef zone.
Can fine-scale substrate info be correlated to coarse-scale habitat info?
Does depth play a role in the location of coarse-scale habitat types? • Mean depth for RCB habitat type is 37 +/- 3.65ft • Mean depth for RA habitat type is 41.71 +/- 5.77ft
Does depth play a role in the location of coarse-scale habitat types? • P=0.088 • Trend indicates that RA habitat occur deeper than RCB
Outline • Background • Part 1: The Marine Data Model (MDM) • Research Questions • Methods • Results • Part 2: Habitat Analysis • Research Questions • Methods • Results • Discussion and Conclusion
Discussion: Habitat Analysis Future research: Tie fine-scale substrate info be tied to specific fish? 1. How do specific fish utilize coarse-scale habitats? A: Inconclusive A. WHAP Fish Info B. Coarse-scale NOAA habitat info Regional Habitat Utilization Patterns? C. Fine-scale WHAP substrate info 3. Does depth play a role in the location of RA and RCB habitat types? A: Strong trend, p=.088 2. Can fine-scale substrate info be correlated to coarse-scale habitat types? A: Yes, PC (p<.05) in RA and a strong trend with PL (p=.059) in RBC
Conclusions: Management • Use information from this study to evaluate current protected areas • For example: • RA habitat shows trends toward being located deeper • P. compressa is found significantly more often in RA habitat • P. compressa provides and important habitat for yellow tang (Tissot et al., 2003, Dollar, 1982) • Thus, to protect the yellow tang, must have protected areas that extend into deeper waters • Consistent with study that MPA encompassing range to depth values shown to be more efficient for yellow tang (Tissot et al, 2004)
Discussion • Through habitat analysis: • Goal 1: Met • Goal 2: Met • Goal 3: Met
Discussion: Ideal User? MDM is tailored to a specific user: • Data • Amount • Variety • Time • Cost • Experience of user • Experienced GIS—use object-orientation • Inexperienced—use template
Conclusions • The MDM is a powerful tool • Information to aid managers evaluate the West Coast MPAs • Future research • Data to HNHP
Thanks to: • All the Rogues in Davy Jones • The Hawaii Natural Heritage Program • DAR, WHAP, CRAMP, and Saving Maui’s Reefs for letting me use their data
Questions? • For more information on the marine data model go to: http://dusk.geo.orst.edu/djl/arcgis/
Habitat Utilization Analysis • What is the habitat utilization pattern of selected fish species at a coarse-scale? (A) WHAP Fish Info Regional Habitat Utilization Patterns? (C) fine-scale WHAP substrate info (B) coarse-scale NOAA habitat info 2. Can fine-scale substrate information be correlated to coarse-scale habitat types? 3. Does depth play a role in the classification of RA and RCB habitat types?
The 13 reef fish analyzed All photos from www.fishbase.org
Statistical Analysis • Porites compressa (finger coral) P=.004 • Significantly more abundant in RA relative to RCB • Porites lobata (lobe coral) p=.059 • Shows strong trends toward being found in RCB relative to RA
What is the habitat utilization pattern of selected fish species at a coarse-scale? • fine vs. coarse-scale habitat information • Importance • Habitat utilization • Management ? www.fishbase.org