Download
1 / 34
420 likes | 1.8k Vues
NCAR Command Language - NCL Juli Rew CISL SOARS, June 4, 2008 Overview of NCL Strategies for Survival Work with Example Programs What We Will Study NCAR Command Language is a complete programming language for processing data and producing high-quality 2D graphics

E N D
NCAR Command Language - NCL Juli Rew CISL SOARS, June 4, 2008
Overview of NCL Strategies for Survival Work with Example Programs What We Will Study
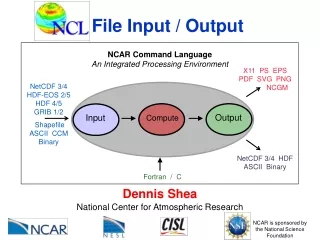
NCAR Command Language is a complete programming language for processing data and producing high-quality 2D graphics NCL commands can be run at the command line, or they can be placed in batch scripts What is NCL?
NCL is built on top of NCAR Graphics, which was originally written in Fortran NCAR Graphics was re-written in object-oriented form, and NCL works with graphical “objects” Thanks to Mary Haley of the CISL Visualization and Technology Section for much of the training information given here NCL History
Freely available Easier to use than conventional programming Competes well with expensive products such as IDL Versatile - it can accept and output data in a variety of formats Produces publication-quality graphics Why Use NCL?
NCL has so many features that it can take a lot of time to master NCL has around 800 functions Before writing any new NCL code, look at the downloadable examples to see if one fits GSUN tutorialhttp://www.ncl.ucar.edu/Document/Manuals/Getting_Started/ GSUN line-by-line exampleswww.ncl.ucar.edu/Document/Manuals/Getting_Started/examples.shtml Strategies for Survival
Use the gsn and csm libraries Documentation is available online at:http://www.ncl.ucar.edu/ Help from fellow users by joiningncl-talk@ucar.edu Subscribe athttp://mailman.ucar.edu/mailman/listinfo/ncl-talk Support: Mary Haley (haley@ucar.edu, ML 35) Strategies for Survival, cont.
begin/end - to start/end scripts (optional) ; - Comment @ - Attribute, e.g.,temperature@units = “Degrees C” Operators like Fortran - + - *, .le., .lt., etc. All parameters are passed by reference (as in Fortran) NCL Syntax
Indexes start at 0 (similar to C) 1D, integer: a = (/1,2,3/) 2D, float: b = (/ (/1.1, .01/), /(.001,.0001/) /) Whole-array syntax is like Fortrana=ba*b (more efficient than looping to copy array) Arrays
Dimensions can be named:temperature!0 = “frtime”temperature!1 = “lat”temperature!2 = “lon” Strings - enclosed in double quotes Syntax, cont.
Coordinate variables- 1D arrays with same name and size as the dimensions they are assigned to- Represent data coordinates for each index of a named dimension- Must be monotonically increasing/decreasingtemperature&frtime = forecast timestemperature&lat = lat_pointstemperature&lon = lon_points Coordinate subscriptstemperature (0,{20:60},{-95:-120}) Syntax, cont.
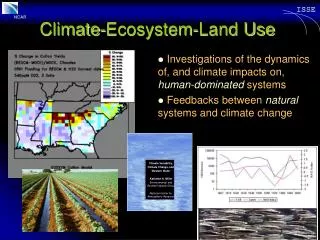
We will emphasize graphics features here Some examples of input and output to/from ASCII text and netCDF data files Graphics
Load necessary libraries Open “workstation” to send graphics to Change the color map (optional) Set plot resources (optional) Draw the graphics Minimum Steps Needed to Create a Plot
load "$NCARG_ROOT/lib/ncarg/nclscripts/csm/gsn_code.ncl" load "$NCARG_ROOT/lib/ncarg/nclscripts/csm/gsn_csm.ncl” First library contains “generic” interfaces and supplemental routines Second library contains gsn_csm interfaces that use CSM conventions. Load order is important. CSM conventions are accepted ways to label data, e.g., units 1. Load the Necessary Libraries
automatic subtitles contour line labels tickmarks out & lat/lon labels informational label automatic labelbar “basic” interface “metadata aware” interface
Can be PostScript (PS or EPS), PDF, X11 window, or NCAR CGM (NCGM) Has a default color map associated with it, but you will probably want to change this (more later) Can have up to 15 multiple workstations open 2. Open graphics “workstation” wks = gsn_open_wks(“x11”,”test”) ; x11 window wks = gsn_open_wks(“ps”,”test”) ; “test.ps” wks = gsn_open_wks(“eps”,”wrf”) ; “wrf.eps” wks = gsn_open_wks(“pdf”,”slp”) ; “slp.pdf”
Do this before drawing anything to the frame. If you use the same color map a lot, can put in “.hluresfile” (more later) Can use one of the other 40+ ones, or create your own. If you don’t change the color map, here’s what you’ll get… 3. Change the color map (opt’l) gsn_define_colormap(wks,”rainbow”)
index 0 is the background color index 1 is the foreground color Pick a better color table… or create your own http://www.ncl.ucar.edu/Document/Graphics/color_table_gallery.shtml http://www.ncl.ucar.edu/Document/Graphics/create_color_table.shtml Default color table (yuck)
Resources are the heart of your NCL graphics code. There are over 1,400 resources! Resources are grouped by object type. There are 11 “graphical” objects: contours, labelbars, legends, maps, primitives, streamlines, text strings, tickmarks, titles, vectors, XY plots 4. Set optional resources
Starts with 2 or 3 lower-case letters based on object it is associated with. Some examples: “xy” - XY Plots “cn” - Contour plots “vc” - Vector plots “ti” - Titles “tm” - Tickmarks “gsn” - special resources not associated with any object Made up of full words with first letter of word capitalized: “xyLineColor”, “cnFillOn”, “tiMainString”, “vcRefMagnitudeF”, “gsnMaximize” Some have an “F” on the end to indicate a floating point resource: “xyLineThicknessF” Detour: Anatomy of a resource
Resources are set by attaching them as attributes to an NCL logical variable: res = True res@mpMinLatF = 30 ; decimal not necessary Most have default values. There are many types: res@tiMainString = “This is a title” res@tmXBLabelFontHeightF = 0.01 res@cnLineLabelsOn = True res@xyLineColors = (/5,7,11/) res@xyLineColors = (/“red”, “green”, “blue”/) Anatomy of a resource (cont’d) http://www.ncl.ucar.edu/Document/Graphics/Resources/
Call one of the gsn_csm_xxxxx functions from the second library we loaded. The general format is: plot = gsn_csm_contour(wks,data,res) plot = gsn_csm_vector(wks,u,v,res) plot = gsn_csm_contour_map(wks,data,res) plot = gsn_csm_pres_hgt(wks,data,res) 5. Draw the graphics http://www.ncl.ucar.edu/Document/Graphics/Interfaces/
NCL scripts that follow can be downloaded from the web: Now for Some NCL Graphics Code Examples http://www.ncl.ucar.edu/Training/Workshops/Scripts/ Scripts have names like xy1a.ncl, xy1b.ncl, … The first one is usually one with no resources set, and each subsequent script adds a few more resources.
setenv NCARG_ROOT ~/ncl-4.2.0.a034 Go to example NCL scripts directory:cd SOARS/NCL To run these scripts:ncl xy1a.ncl Let’s look at what’s in our first script using vi:vi xy1a.ncl Running NCL
Line color changed (using color index values) Default color map used Resource introduced: xyLineColor - sets curve color Example xy1b.nclgsn_csm_y
X values added Line color changed (using named color) Line thickness increased “long_name” attributes set Resource introduced: xyLineThicknessF - sets line thickness Example xy1c.nclgsn_csm_xy
Axes limits changed Resources introduced: trYMinF, trYMaxF, trXMinF, trXMaxF - sets mins and maxes for X and Y axes (transformation resources) These resources can also apply to contour, vector, and streamline plots Example xy1d.nclgsn_csm_xy
Dash pattern set for curve Title resources set Resources introduced: xyDashPattern - sets dash pattern for curve (17 available) tiMainString, tiXAxisString, tiYAxisString - sets strings for axes and main title, can also be used for contour, vector, etc, plots If have both long_name attributes and tiX/YString set, ti* resources will take effect Example xy1e.nclgsn_csm_xy
Explicitly set the bottom tickmark labels Resources introduced: tmXBMode, tmXBValues, tmXBLabels - sets strings for bottom tickmarks Note about tickmark resources: all four sides of the axes have their own set of tickmarks, for example: tmYLMode (Y left), tmYRMode (Y right), tmXTMode (X top) Example xy1f.nclgsn_csm_xy
Generating some bogus wind data Each array entry has two components: wind speed and wind direction There is a special function for creating wind roses, called WindRoseBasic Data will be written to an ASCII file This example online athttp://www.ncl.ucar.edu/Applications/rose.shtml Example rose_1.ncl
Now we are reading our data from an ASCII file called “Bogus.dat” that we created previously Recall that there are two components to each array entry Example rose_1a.ncl
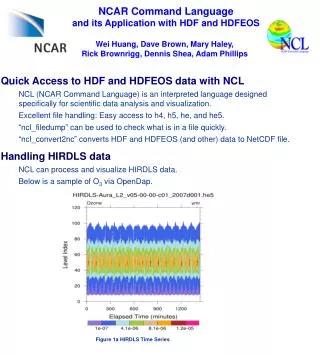
This example reads from a netCDF file and contours the temperature fields Fourth plot uses a predefined color table; seewww.ncl.ucar.edu/Document/Graphics/color_table_gallery.shtml Original example online at:www.ncl.ucar.edu/Document/Manuals/Getting_Started/Examples/gsun02n.shtml Example contour.ncl
Animate NCL image files using idt (part of NCL) Movies: Save series of images to Postscript files. Convert images to mpg using “convert” utility of ImageMagick Or use utility such as ncview to view netCDF data file Example movie:http://www.cisl.ucar.edu/docs/hpc_modeling/graphics.jsp Animation
NCL Workshop this summer July 8-11 Register by July 1 Info:http://www.ncl.ucar.edu/Training/Workshops/ More Training Available